

Prediction of three-year all-cause mortality in patients with heart failure and atrial fibrillation using the CatBoost model
- PMID: 40615809
- PMCID: PMC12232015
- DOI: 10.1186/s12872-025-04928-w
Prediction of three-year all-cause mortality in patients with heart failure and atrial fibrillation using the CatBoost model
Abstract
Background: Heart failure and atrial fibrillation (HF-AF) frequently coexist, resulting in complex interactions that substantially elevate mortality risk. This study aimed to develop and validate a machine learning (ML) model predicting the 3-year all-cause mortality risk in HF-AF patients to support personalized risk stratification and management.
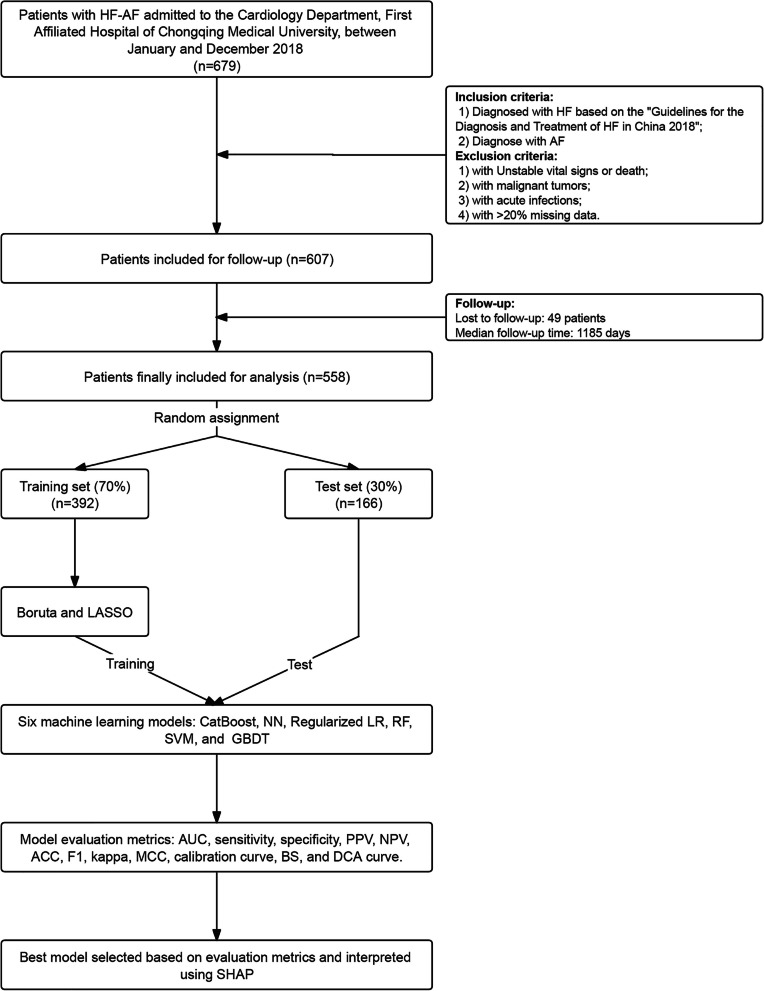
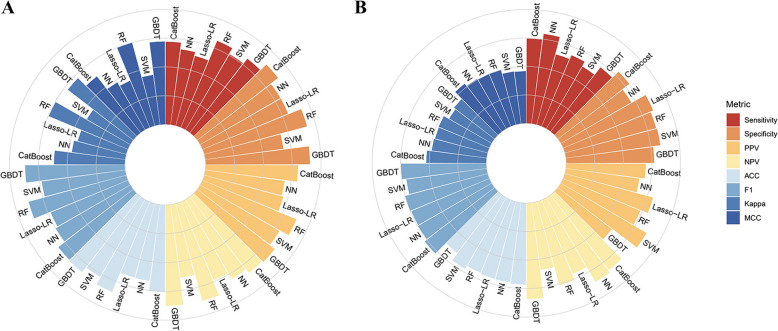
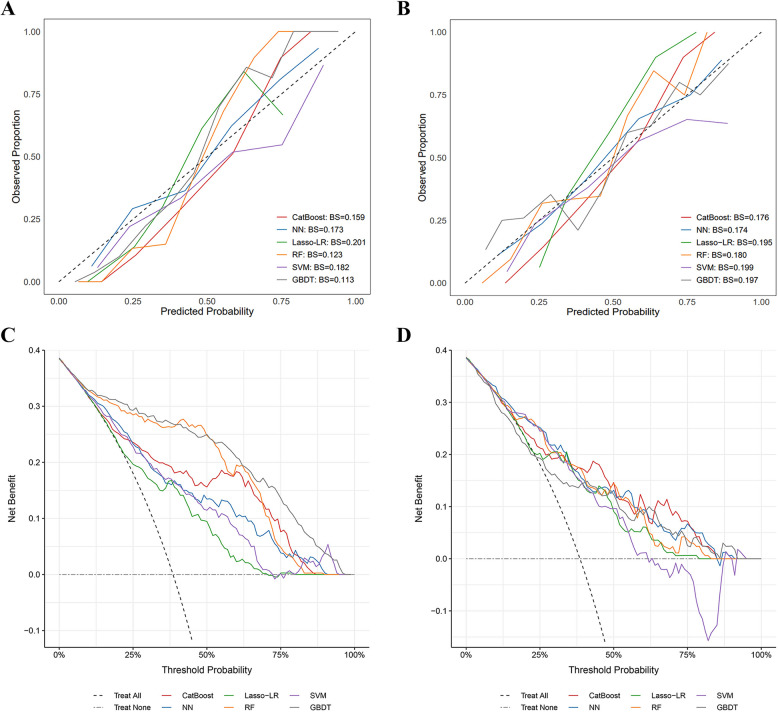
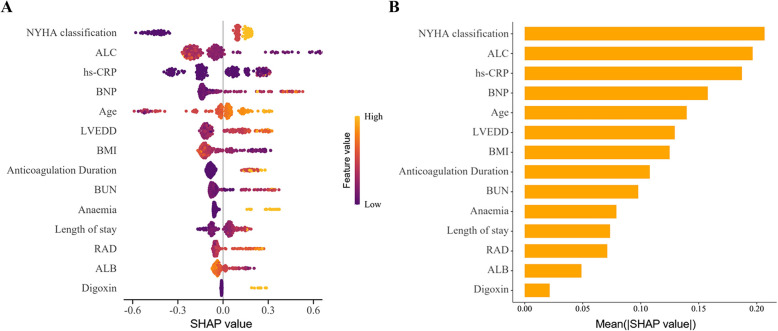
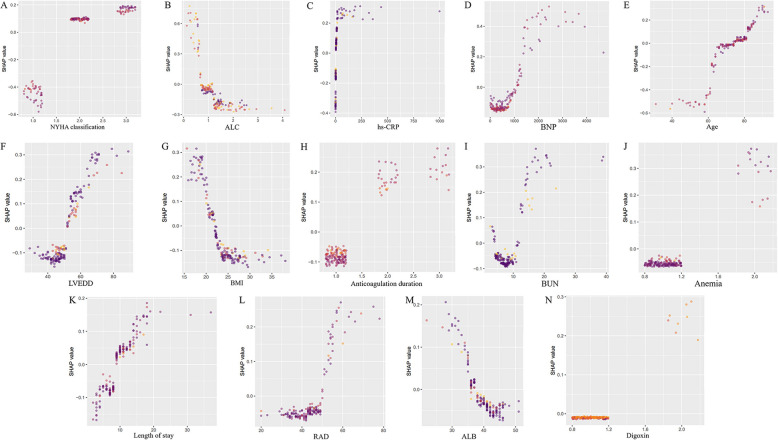
Method: This retrospective cohort study included 558 HF-AF patients admitted in 2018, with a median follow-up duration of 1,185 days. The cohort was randomly divided into training (70%) and test (30%) sets. Feature selection utilized the Boruta algorithm and least absolute shrinkage and selection operator regression. Six ML models were trained using tenfold cross-validation and optimized via grid search. Model performance was evaluated across 12 metrics, including the area under the receiver operating characteristic curve (AUC), to identify the best-performing model. Subsequently, Shapley Additive exPlanations (SHAP) analysis was used to interpret the optimal model and investigate interactions between features.
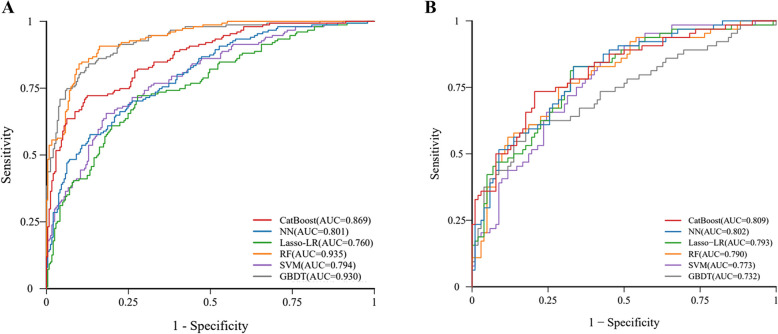
Results: Of the 558 patients, 215 reached the primary endpoint. Feature selection identified 14 key variables for model development. The best-performing model, CatBoost, achieved the highest AUC (0.809) and demonstrated robust performance across multiple evaluation metrics. SHAP analysis highlighted the New York Heart Association (NYHA) classification, absolute lymphocyte count (ALC), high-sensitivity C-reactive protein, B-type natriuretic peptide (BNP), and age as key predictors. SHAP interaction analysis identified several feature interactions, with relatively strong ones observed between ALC and NYHA classification, and ALC and BNP.
Conclusions: CatBoost was identified as the optimal model for predicting three-year all-cause mortality in HF-AF patients, potentially aiding clinicians in risk stratification and individualized treatment planning to improve patient outcomes.
Keywords: All-cause mortality; Atrial fibrillation; Heart failure; Machine learning; Prediction model.
© 2025. The Author(s).
Conflict of interest statement
Declarations. Ethics approval and consent to participate: The present study involves human participants and was approved by the Ethics Committee of the First Hospital of Chongqing Medical University (reference number 2020-528) and adhered to the guidelines of the Helsinki Declaration. Written informed consent was obtained from all individual participants. Consent for publication: Informed consent was obtained from all individual participants included in the study. Competing interests: The authors declare no competing interests.
Figures
Similar articles
-
Supervised Machine Learning Models for Predicting Sepsis-Associated Liver Injury in Patients With Sepsis: Development and Validation Study Based on a Multicenter Cohort Study.J Med Internet Res. 2025 May 26;27:e66733. doi: 10.2196/66733. J Med Internet Res. 2025. PMID: 40418571 Free PMC article.
-
Novel predictive role of glomerular filtration rate in atrial fibrillation development among chronic heart failure patients.BMC Cardiovasc Disord. 2025 Jul 10;25(1):503. doi: 10.1186/s12872-025-04966-4. BMC Cardiovasc Disord. 2025. PMID: 40640715 Free PMC article.
-
Optimized feature selection and advanced machine learning for stroke risk prediction in revascularized coronary artery disease patients.BMC Med Inform Decis Mak. 2025 Jul 24;25(1):276. doi: 10.1186/s12911-025-03116-2. BMC Med Inform Decis Mak. 2025. PMID: 40707947 Free PMC article.
-
Atrial fibrillation and the risk for myocardial infarction, all-cause mortality and heart failure: A systematic review and meta-analysis.Eur J Prev Cardiol. 2017 Sep;24(14):1555-1566. doi: 10.1177/2047487317715769. Epub 2017 Jun 15. Eur J Prev Cardiol. 2017. PMID: 28617620 Free PMC article.
-
The comparative and added prognostic value of biomarkers to the Revised Cardiac Risk Index for preoperative prediction of major adverse cardiac events and all-cause mortality in patients who undergo noncardiac surgery.Cochrane Database Syst Rev. 2021 Dec 21;12(12):CD013139. doi: 10.1002/14651858.CD013139.pub2. Cochrane Database Syst Rev. 2021. PMID: 34931303 Free PMC article.
References
-
- Elliott AD, Middeldorp ME, Van Gelder IC, Albert CM, Sanders P. Epidemiology and modifiable risk factors for atrial fibrillation. Nat Rev Cardiol. 2023;20(6):404–17. - PubMed
-
- Reddy YNV, Borlaug BA, Gersh BJ. Management of Atrial Fibrillation Across the Spectrum of Heart Failure With Preserved and Reduced Ejection Fraction. Circulation. 2022;146(4):339–57. - PubMed
-
- Vermond RA, Geelhoed B, Verweij N, Tieleman RG, Van der Harst P, Hillege HL, et al. Incidence of Atrial Fibrillation and Relationship With Cardiovascular Events, Heart Failure, and Mortality: A Community-Based Study From the Netherlands. J Am Coll Cardiol. 2015;66(9):1000–7. - PubMed
-
- Carlisle MA, Fudim M, DeVore AD, Piccini JP. Heart Failure and Atrial Fibrillation, Like Fire and Fury. JACC Heart Fail. 2019;7(6):447–56. - PubMed
Publication types
MeSH terms
Grants and funding
LinkOut - more resources
Full Text Sources
Medical
Research Materials
Miscellaneous
