Clinical Trial
. 2025 Jul 4;17(1):146.
doi: 10.1186/s13195-025-01791-x.

Low-dose interleukin-2 in patients with mild to moderate Alzheimer's disease: a randomized clinical trial

Affiliations
Clinical Trial

Low-dose interleukin-2 in patients with mild to moderate Alzheimer's disease: a randomized clinical trial

Alireza Faridar et al. Alzheimers Res Ther. .

Abstract

Background: We previously documented that regulatory T cells (Tregs) immunomodulatory mechanisms are compromised in Alzheimer's disease (AD), shifting the immune system toward a pro-inflammatory response. However, Tregs are a potentially restorable therapeutic target in AD. In this study, we evaluated the safety and efficacy of two dosing frequencies of low-dose Interleukin-2 (IL-2) in expanding Tregs to modify disease progression in AD individuals.

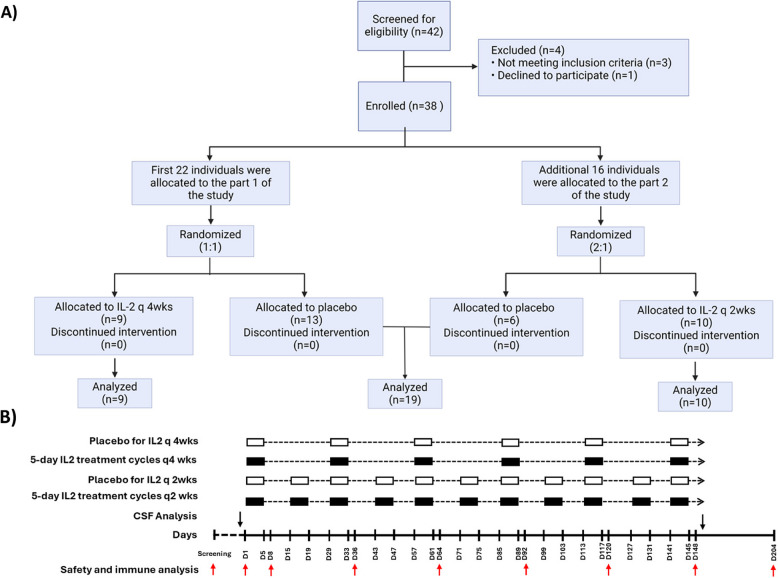
Methods: In this phase 2a, randomized, double-blind, placebo-controlled study, 38 participants were assigned to receive subcutaneous IL-2 (10^6 IU/day) for five days, administered either every 4 weeks (IL-2 q4wks) or every 2 weeks (IL-2 q2wks), versus placebo, for 21 weeks, followed by 9 weeks of observation. The primary endpoints were the incidence and severity of adverse events. For the secondary endpoints, changes in Treg numbers and suppressive functions were evaluated. Exploratory endpoints included changes in plasma inflammatory mediators, CSF AD-related biomarkers, and clinical scales.

Results: Of the 38 participants, 9 received IL-2 q4wks, 10 received IL-2 q2wks, and 19 received placebo. All participants completed the trial with no serious adverse events or deaths. Both IL-2 dosing regimens increased Treg numbers and suppressive function, but IL-2 q4wks treatment exhibited superiority in enhancing Treg percentage and Foxp3 mean fluorescent intensity. In longitudinal analysis of 45 inflammatory mediators, IL-2 q4wks administration demonstrated greater efficacy in alleviating the plasma inflammatory mediators CCL2, CCL11, and IL-15, while enhancing IL-4 and CCL13 levels. A significant improvement in CSF Aβ42 levels (p = 0.045 vs. placebo) on Day 148 was observed following IL-2 q4wks administration, compared to placebo. While CSF NfL increased by 217 pg/ml in placebo recipients, it remained stable in the IL-2 q4wks group (p = 0.060, IL-2 q4wks vs. placebo). The adjusted mean change from baseline in the ADAS-cog score at week 22 indicated a trend toward slower clinical progression in IL-2 q4wks recipients compared to placebo (p = 0.061).

Conclusions: The IL-2 immunotherapeutic strategy was safe and well-tolerated. IL-2 q4wks effectively expanded Treg populations, leading to modification in inflammatory mediators and CSF Aβ42 levels, while also showing promising trends on clinical scales. These findings provide a foundation for further investigation of low-dose IL-2 as a potential treatment for Alzheimer's Disease.

Trial registration: ClinicalTrials.gov Identifier: NCT06096090, Registration Date: 10-17-2023.

Keywords: Alzheimer’s Disease; Clinical trial; Immune system; Immunotherapy; Inflammation; Treg.


Conflict of interest statement

Declarations. Ethics approval and consent to participate: The trial was approved by the Houston Methodist Research Institute (HMRI) institutional review board (IRB) committee. All patients signed informed consent prior to study enrolment. Consent for publication: Not applicable. Competing interests: AF, ADT, JCM, JRT declares a conflict of interest as a consultant with Coya Therapeutics, Inc. SHA declares a conflict of interest as a consultant with Implicit Bioscience and scientific advisory board chair of Coya Therapeutics, Inc. DRB declares a conflict of interest as a consultant with Implicit Bioscience and Coya Therapeutics, Inc. MG is an employee of Global R&D Partners, LLC, which received consulting fees from HMRI. CD is an employee of CSD Biostatistics, Inc, which received consulting fees from HMRI. Remaining authors have no conflict of interest.

Figures

Fig. 1
Fig. 1
Flow diagram and intervention. A Subjects screened for the study and those eligible were enrolled. The first 22 participants were randomized to receive five-day courses of subcutaneous Interleukine-2 (IL-2) every 4 weeks (IL-2 q4wks), or placebo (1:1 ratio). 16 additional participants were randomized to receive IL-2 every two weeks (IL-2 q2wks) or placebo (2:1 ratio). All enrolled individuals completed the treatment phase and underwent assessment for the primary safety endpoints. B Schematic representation of the 5-day IL-2 administration cycles (black rectangles) in the two treatment arms-IL-2 q4wks and IL-2 q2wks-as well as the corresponding placebo administrations (white rectangles). Blood samples (red arrows) for safety and immune analysis are drawn on day 1 (before IL-2 administration), days 8, 36, 64, 92, 120, and 148 during the treatment phase, as well as on day 204 during the post-treatment phase
Fig. 2
Fig. 2
Effect of low-dose IL-2 treatment on Treg population. A The percentage of CD4+ T cells that were FOXP3+CD25 high (i.e., Tregs) was assessed by flow cytometry at baseline (D1), throughout the treatment phase on D8, D36, D64, D92, D120 and D148, and at the end of the follow-up (F/U) phase at D204 among three arms: IL-2 every 4 weeks (IL-2 q4wks), IL-2 every 2 weeks (IL-2 q2wks), and placebo. B Foxp3 mean fluorescence intensity (MFI) and C CD25 MFI in the Treg population were also monitored. D The suppressive function of isolated Tregs on corresponding T responder (Tresp) cell proliferation in vitro, at a 1:1 Treg to Tresp ratio, was assessed. D = Day. Data represent mean changes from baseline ± SE. Comparison across the three arms were compared using ANCOVA. P-values are represented as *p < 0.05, **p < 0.01, and ***p < 0.001 for IL-2 q4wks or IL-2 q2wks versus placebo, and #p < 0.05, ##p < 0.01, and ###p < 0.001 for IL-2 q4wks versus IL-2 q2wks
Fig. 3
Fig. 3
Effect of low-dose IL-2 treatment on plasma inflammatory biomarkers. Plasma levels of immune-related biomarkers, including IL15 (A), CCL11 (B), CCL2 (C), IL-4 (D) and CCL13 (E) were measured longitudinally using Olink protein analysis at baseline (D1), throughout the treatment phase (D8, D64, D92, D120, and D148), and at the end of the follow-up (F/U) phase on D204 across three study arms: IL-2 every 4 weeks (IL-2 q4wks), IL-2 every 2 weeks (IL-2 q2wks), and placebo. D = Day. Data represent mean changes from baseline ± SE. Comparison across the three arms were compared using ANCOVA. P-values are represented as *p < 0.05, **p < 0.01, and ***p < 0.001 for IL-2 q4wks or IL-2 q2wks versus placebo, and #p < 0.05 for IL-2 q4wks versus IL-2 q2wks
Fig. 4
Fig. 4
Effect of low-dose IL-2 treatment on Alzheimer’s disease biomarkers. Alzheimer’s disease (AD) cerebrospinal fluid (CSF) biomarkers, including A-beta 42 (Aβ42) (A), neurofilament light chain (NfL) (B), glial fibrillary acidic protein (GFAP) (C), and phosphorylated tau 181 (p-tau181) (D), were measured using the Simoa Quanterix assay at screening (SC) and at the end of the treatment phase on Day 148 (D148). Data represents mean changes from baseline ± SE. Comparisons across the three arms were made using ANCOVA. P-values are represented as *p < 0.05
Fig. 5
Fig. 5
Effect of low-dose IL-2 treatment on clinical scales. Cognitive tests, including the Alzheimer’s Disease Assessment Scale–Cognitive Subscale (ADAS-Cog) (A), Clinical Dementia Rating Scale Sum of Boxes (CDR-SB) (B), and Alzheimer’s Disease Cooperative Study-Clinical Global Impression of Change (ADCS-CGIC) (C), were conducted at screening (SC), day 64 (D64), and day 148 (D148). Data represents mean changes from baseline ± SE. An increase in the scores in all these tests indicates cognitive deterioration. For ADAS-Cog and CDR-SB, comparisons across the three arms were made using the MMRM model. The CGIC variables were analyzed using the Cochran-Mantel–Haenszel mean score test

References

    1. Jansen IE, Savage JE, Watanabe K, Bryois J, Williams DM, Steinberg S, et al. Genome-wide meta-analysis identifies new loci and functional pathways influencing Alzheimer’s disease risk. Nat Genet. 2019;51(3):404–13. - PMC - PubMed
    1. Bellenguez C, Kucukali F, Jansen IE, Kleineidam L, Moreno-Grau S, Amin N, et al. New insights into the genetic etiology of Alzheimer’s disease and related dementias. Nat Genet. 2022;54(4):412–36. - PMC - PubMed
    1. Venegas C, Kumar S, Franklin BS, Dierkes T, Brinkschulte R, Tejera D, et al. Microglia-derived ASC specks cross-seed amyloid-beta in Alzheimer’s disease. Nature. 2017;552(7685):355–61. - PubMed
    1. Bellaver B, Povala G, Ferreira PCL, Ferrari-Souza JP, Leffa DT, Lussier FZ, et al. Astrocyte reactivity influences amyloid-beta effects on tau pathology in preclinical Alzheimer’s disease. Nat Med. 2023;29(7):1775–81. - PMC - PubMed
    1. Liu Y, Dai Y, Li Q, Chen C, Chen H, Song Y, et al. Beta-amyloid activates NLRP3 inflammasome via TLR4 in mouse microglia. Neurosci Lett. 2020;736:135279. - PubMed

Publication types

Associated data