. 2025 Jul 4;13(1):145.
doi: 10.1186/s40478-025-02063-3.

Brain macrophages and pial fibroblasts promote inflammation in a hypomyelination model

Affiliations

Brain macrophages and pial fibroblasts promote inflammation in a hypomyelination model

Noriko Okuno et al. Acta Neuropathol Commun. .

Abstract

Many neurological diseases remain difficult to treat, necessitating further elucidation of their pathogenesis. Conditional inactivation of Pdgfra in Nestin-expressing cells leads to the depletion of platelet-derived growth factor receptor-alpha+ (PDGFRα+) oligodendroglial lineage cells responsible for myelination, resulting in forebrain hypomyelination and severe, progressive neurological deficits in neonatal mice. The present study examined the cerebral cortex of these mice to better understand the mechanisms underlying such progressive neurological deficits, that are often observed in refractory neurological diseases. Histological and single-cell RNA sequencing analyses showed that, following activation of meningeal border-associated macrophages (BAMs), PDGFRα+ fibroblasts that escaped gene inactivation were extensively recruited from the meninges into the hypomyelinated subpial cerebral cortex. Transcriptional reprogramming suggested that these fibroblasts originated from the pial fibroblast lineage and adopted a myofibroblast-like transcriptional phenotype. The recruited fibroblasts established stable cell-cell interactions with activated brain macrophages, including BAMs and microglia, accompanied by signaling pathways associated with chronic, tissue-damaging inflammation. Subsequently, inflammatory cortical lesions emerged, characterized by glial activation, angiogenesis, and neuronal oxidative stress. Treatment with a PDGFRα-neutralizing antibody significantly reduced fibroblast recruitment and mitigated glial activation and angiogenesis. These findings suggest that meningeal BAMs and pial fibroblasts are key contributors to the formation of tissue-damaging subpial cortical lesions. The interactions between brain macrophages and pial fibroblasts may contribute to the mechanisms underlying chronic and progressive neurological deficits and represent potential therapeutic targets for refractory neurological diseases.

Keywords: Angiogenesis; Border-associated macrophage; Fibrosis; Myelination failure; PDGFRα; Perivascular fibroblast.


Conflict of interest statement

Declarations. Ethics approval and consent to participate: All animal procedures were conducted in accordance with guidelines laid out by the Institutional Animal Care and Use Committee at the University of Toyama (University of Toyama, Sugitani, Toyama City, Japan). All study protocols were approved by the Ethics Committee of the University of Toyama. Consent for publication: All authors agree with publication. Competing interests: The authors declare no competing interests.

Figures
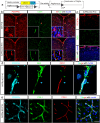
Fig. 1
Fig. 1
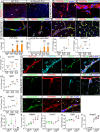
PDGFRα+/NG2/COL1+ perivascular fibroblasts increased in the cerebral cortex of N-PRα-KO mice with depleted OPCs. a Transgenic and mutated alleles in N-PRα-KO mice, harboring a Nestin promoter/enhancer-driven Cre recombinase, possessing a nuclear localization signal (nls) and Pdgfra flanked by loxP sequences. b Immunofluorescence for PDGFRα and CD31 in WT and N-PRα-KO cortex at P15. Arrowheads: perivascular PDGFRα+ cells exclusively localized near the meninges in WT mice. c Immunofluorescence of PDGFRα and NG2 in N-PRα-KO cortex at P10. d Immunofluorescence of PDGFRα, NG2, and CD31 in N-PRα-KO cortex at P10. Cyan arrowheads: PDGFRα⁺ cells, green arrowheads: NG2⁺ pericytes. e Immunofluorescence of PDGFRα, COL1, and CD31 in N-PRα-KO cortex at P15. Nuclei are counterstained with Hoechst. Scale bars, 250 μm (b and c), 20 μm (insets of b), 5 μm (d), and 25 μm (e). See also Fig. S1a−f
Fig. 2
Fig. 2
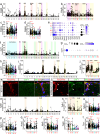
PDGFRα+ fibroblasts with pial fibroblast-like immunophenotype express numerous cytokines and angiogenetic factors in the cerebral cortex of N-PRα-KO mice. a Immunofluorescence of PDGFRα and COL1 in WT and N-PRα-KO cortex at P10. Arrowheads: pvFs in the WT cortex limited in COL1+ large-sized blood vessels. (b−g) Immunofluorescence of PDGFRα, b NG2, c CD31, d RALDH1, e RALDH2, f S100A6, and g PDGFRβ in N-PRα-KO cortex at P10. h pvF area in WT (WT) and N-PRα-KO (KO) cortex; n = 6−8, one area randomly selected from the left and right cerebral hemispheres. i indFs in WT (WT) and N-PRα-KO (KO) cortex; n = 6, two areas randomly selected per mouse. (j−n) mRNA expression levels of jAldh1a1, kAldh1a2, lCxcl12, mTgfb1, and nAngpt2 in WT (WT) and N-PRα-KO (KO) brains; n = 5−6 per genotype; *p < 0.05, **p < 0.01, ***p < 0.001, ****p < 0.0001 versus WT at the same time point. ##p < 0.01, ####p < 0.0001 versus P5 in the same genotype. All values represent means ± SEM. Nuclei were counterstained with Hoechst. Scale bars, 25 μm (b, d, and e), 250 μm (a), 20 μm (c), and 50 μm (f and g). o Immunofluorescence of CXCL12, PDGFRα, and CD31 in N-PRα-KO cortex at P15. Cyan arrowheads: PDGFRα+/ CXCL12+/CD31 cells, Green arrowheads: PDGFRα/ CXCL12/CD31+ cells. p Immunofluorescence of pSmad2/3, PDGFRα, and CD31 in N-PRα-KO cortex at P10. q Immunofluorescence of angiopoietin 2 and PDGFRα in N-PRα-KO cortex at P15. Arrowheads: PDGFRα+/ angiopoietin2+ cells. Nuclei counterstained with Hoechst. Scale bars, 25 μm (o and q) and 50 μm (p). (r−v) mRNA expression levels of rPdgfra, sPdgfrb, tCxcl12, uTgfb1, and vAngpt2 of cultured skin fibroblasts (skFs) and PDGFRα+ brain fibroblasts (praFs) cultured with in vitro supplemented PDGF-AB (+ AB) or PDGF-BB (+ BB), or without PDGF ligands (−). *p < 0.05, **p < 0.01 versus control without PDGF treatment within the same fibroblast. #p < 0.05, ##p < 0.01, ###p < 0.001, ####p < 0.0001 versus skFs of the same culture condition; n = 3 per cultured condition. All values represent means ± SEM. See also Fig. S1g−j, S2, and S3
Fig. 3
Fig. 3
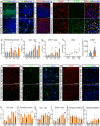
Implication of fibroblasts with gene expression profiles of pial fibroblasts in the cortical lesion of N-PRα-KO mice. (a−c) UMAP projection of nine clusters segregated by Seurat; a genotypes overlaid, b WT, and c N-PRα-KO. d Nine cell clusters identified by non-hierarchical analysis, Seurat. e Heatmap of the top 10 genes for each cell cluster, such as Col4a1, Col15a1, and Fbln2. Asterisks indicate the top 10 genes overlapping with those in Cluster VI. Purple: minimal, black intermediate, and yellow high expression. f Heatmap of the compartment-specific genes in meningeal fibroblasts (pia, arachnoid, and dura matter). Expression of each gene is color-coded on the logFC of the dataset: blue denotes minimal, white intermediate, and red high expression. g Pseudo-time plots of Clusters I, VI, and VII in (A) that have pial gene expression profile; sub-divided into five states: i−v. h Five states of fibroblasts identified by pseudotime analysis, Monocle. (i, j) Pathway enrichment analyses of i Clusters I, VI, and VII, and j cellular states i−v analyzed according to gene ontology (GO) terms. The upregulated genes in each state were evaluated compared to state iv. The upregulated genes in state iv were detected by comparison with all other states. See also Fig. S4−S6 and Note S1
Fig. 4
Fig. 4
Partial transcriptional transition from BFB1b to BFB1a subtype in pial fibroblasts, and precedent BAM activation in the cerebral cortex of N-PRα-KO mice. (a, b) Heat map of the representative cell type-specific genes of a BFB1a cells and b BFB1b cells in the cellular states obtained by Monocle. Blue denotes minimal, green to yellow intermediate, and red high expression. (c−t) Violin plots of cCol4a1, dItih5, eCol15a1, fCol4a2, gEdn3, hAldh1a1, iSpp1, jLpl, kCol12a1, lEce1, mCcdc80, nFam180a, oSerpine2, pMgp, qClec3b, rNgfr, sTnxb, and tCpxm2 in the five cellular states. Cyan: cells from WT mice, red: cells from N-PRα-KO mice. *p < 0.05, **p < 0.01, ***p < 0.001, ****p < 0.0001 versus WT cells of state iv. Red asterisks: upregulation, blue: downregulation. u Immunofluorescence of CD206 in the cortex of WT and N-PRα-KO mice at P1, P7, and P10. Nuclei counterstained with Hoechst. Scale bars, 75 μm. (v, w) CD206⁺ cells of v meninges and w perivascular area in WT (WT) and N-PRα-KO (KO) cortex; n = 12, four areas randomly selected per mouse for meninges; n = 6−8, two areas randomly selected per mouse for perivascular areas. (x, y) Immunofluorescence of x CD206 and LYVE1, y LYVE1 and CCL5 in N-PRα-KO cortex at P7 (KO P7). Nuclei counterstained with Hoechst. Scale bars, 25 μm (x and y). (z-ad) mRNA expression levels of zCcl5, aaCcr5, abTnf, acPtgs1, and adPtgs2 in WT (WT) and N-PRα-KO (KO) brains; n = 5−6 in each genotype. *p < 0.05, **p < 0.01, ***p < 0.001, ****p < 0.0001 versus WT at the same time point. All values represent means ± SEM
Fig. 5
Fig. 5
Transcriptional profiling defines cell–cell interactions between brain macrophages and fibroblasts in N-PRα-KO mice. a Violin plots of Pdgfb in 32 cell clusters obtained by PhenoGraph. b Violin plots of Pdgfb in endothelial cell, microglia, mural cell, and BAM clusters within the 32 cell clusters obtained by PhenoGraph, comparing WT and N-PRα-KO derived cells. (c, d) Violin plots of cPdgfra and dPdgfrb in pial fibroblast states i−v obtained by Monocle. e Gene expression encoding major growth factor receptors in pial fibroblast states i−v obtained by Monocle. f Violin plots of Csf1 in 32 cell clusters obtained by PhenoGraph. gCsf1 in eight fibroblast clusters obtained by Seurat, comparing WT and N-PRα-KO derived cells. h Violin plots of Csf1 in five pial fibroblast states obtained by Monocle. i Violin plots of Csf1r in 32 cell clusters obtained by PhenoGraph. j Violin plots of Csf1r in microglia, mural cell, and BAM clusters within the 32 cell clusters obtained by PhenoGraph, comparing WT and N-PRα-KO derived cells. (k, l) Immunofluorescence of PDGFRα (red) and CSF1 (green) in the cortex of k WT and l N-PRα-KO mice at P15. Nuclei counterstained with Hoechst. Scale bar, 10 μm. m Violin plots of Tgfb1 in 32 cell clusters obtained by PhenoGraph. n Violin plots of Tgfb1 in microglia and BAM clusters within the 32 cell clusters obtained by PhenoGraph, comparing WT and N-PRα-KO derived cells. (o−t) Violin plots of oTgfbr2, pTgfbr3, qActa2, rMyl9, sTagln, and tTns1 in pial fibroblast states i−v obtained by Monocle. EC, endothelial cell; MG, microglia; Fb, fibroblast. Cyan: cells from WT mice, red: cells from N-PRα-KO mice in (b−e, g, h, j, n−t). *p < 0.05, **p < 0.01, ***p < 0.001, ****p < 0.0001 versus WT cells of each cluster in (b, j, n), versus WT cells of state iv in (c, d, h, o−t). Red asterisks: upregulation, blue: high expression; and size represents the percentage of cells expressing each marker in (e, g). See also Fig. S7
Fig. 6
Fig. 6
Transcriptional profiling discloses the molecules related to cell–cell interactions between brain macrophages and fibroblasts in N-PRα-KO mice. a Violin plots of Cxcl12 in 32 cell clusters obtained by PhenoGraph. b Dot plots of Csf1 in eight fibroblast clusters obtained by Seurat, comparing WT and N-PRα-KO derived cells. Gray: minimal expression, blue: high expression; size represents the percentage of cells expressing each marker. c Violin plots of Cxcl12 in five pial fibroblast states obtained by Monocle. d Violin plots of Cxcr4 in 32 cell clusters obtained by PhenoGraph. e Violin plots of Tnf in 32 cell clusters obtained by PhenoGraph. f Violin plots of Tnf in microglia and BAM clusters within the 32 cell clusters obtained by PhenoGraph, comparing WT and N-PRα-KO derived cells. g Violin plots of Cyba in 32 cell clusters obtained by PhenoGraph. h Violin plots of Cyba in microglia and BAM clusters within the 32 cell clusters obtained by PhenoGraph, comparing WT and N-PRα-KO derived cells. i Violin plots of Tnfrsf1a in pial fibroblast states i−v obtained by Monocle. (j, k) Violin plots of Itga1 in eight fibroblast clusters obtained by j Seurat and in five pial fibroblast states obtained by k Monocle. (l, m) Violin plots of Cdh11 in eight fibroblast clusters obtained by l Seurat and in five pial fibroblast states obtained by m Monocle. (n, o) Violin plots of Yap1 in eight fibroblast clusters obtained by n Seurat and in five pial fibroblast states obtained by o Monocle. (p, q) Violin plots of Wwtr1 in eight fibroblast clusters obtained by p Seurat and in five pial fibroblast states obtained by q Monocle. r Violin plots of Gas1 in five pial fibroblast states obtained by Monocle. EC, endothelial cell; MG, microglia; Fb, fibroblast. The cyan numerical denotes cells from WT mice, and the red numerical denotes cells from N-PRα-KO mice in (b, c, f, h, i, k, m, o, q, and r). *p < 0.05; **p < 0.01, ***p < 0.001, ****p < 0.0001 versus WT cells of each cluster (f and h), versus WT cells of state (c, i, k, m, o, q and r), versus the entire cell population excluding clusters I, VI and VII (b, j, l, n, and p). Red asterisks: upregulation, blue asterisks: downregulation. (s−u) Immunofluorescence of YAP1 (green) and PDGFRα (red) in the cortex of WT (s) and N-PRα-KO (t, u) mice at P15. Nuclei were counterstained with Hoechst. Scale bar, 10 μm (s, t) and 5 μm (u). White arrowheads: PDGFRα+ fibroblasts with positive nuclear staining for YAP1 (t, u). See also Fig. S7, 8 and Note S2
Fig. 7
Fig. 7
PDGFRα neutralization suppresses pvF recruitment and ameliorates histological alterations, excluding BAM activation, in the cortex of N-PRα-KO mice. (a−d) Immunofluorescence of a MBP, b Iba1, c GFAP, d NeuN, and 4HNE in the cortex of WT and N-PRα-KO mice at P15. Nuclei counterstained with Hoechst. Scale bars, 250 μm (a), 25 μm (b), 100 μm (c), 10 μm (d). (e−g) e Penetrating blood vessels, f Iba1⁺ cells, and g GFAP⁺ areas in the cortex of WT (WT) and N-PRα-KO (KO) mice; n = 8−10, two areas randomly selected from each mouse (e, g); n = 12, four fields randomly selected per mouse f. h mRNA expression levels of Gfap in WT (WT) and N-PRα-KO (KO) mouse brain. n = 5–6/genotype. i 4-HNE expression levels in NeuN⁺ neurons in the cortex of WT(WT) and N-PRα-KO (KO) mice at P15; n = 30−40, ten NeuN+ neurons randomly selected per mouse. *p < 0.05, **p < 0.01, ***p < 0.001, ****p < 0.0001 versus WT at the same time point. All values represent means ± SEM. (j−n) Immunofluorescence of j PDGFRα, k CD31, l Iba1, m GFAP, and n CD206 in the cortex of PBS-treated (KO P15 + PBS) and PDGFRα-neutralizing antibody-treated N-PRα-KO (KO P15 + Neu) mice at P15. Nuclei counterstained with Hoechst. Scale bars, 250 μm (j and m), 75 μm (k and n), and 25 μm (l). (o−t) o pvF area, p penetrating blood vessels, q Iba1+ cells, r GFAP+ areas, and CD206+ cells in s meninges and t parenchymal perivascular area of N-PRα-KO mice treated with PDGFRα-neutralizing antibody (Neu) (black hatched), and age-matched control N-PRα-KO mice treated with vehicle (PBS) (white hatched) or control IgG (IgG2) (gray hatched); n = 4−7 mice/genotype (o, p, r), n = 8−10, two areas randomly selected per mouse (q); n = 12, four areas randomly selected per mouse (s); n = 6−8, two areas randomly selected per mouse (t). *p < 0.05, **p < 0.01, ****p < 0.0001 versus age-matched vehicle treated controls. #p < 0.05, ##p < 0.01 versus non-immune IgG treated controls. All values represent means ± SEM. See also Fig. S9

References

    1. Adler M, Mayo A, Zhou X, Franklin RA, Jacox JB, Medzhitov R, Alon U (2018) Endocytosis as a stabilizing mechanism for tissue homeostasis. Proc Natl Acad Sci U S A 115: E1926-E1935 10.1073/pnas.1714377115 - PMC - PubMed
    1. Aldrich A, Kielian T (2011) Central nervous system fibrosis is associated with fibrocyte-like infiltrates. Am J Pathol 179:2952–2962. 10.1016/j.ajpath.2011.08.036 - PMC - PubMed
    1. Armulik A, Genove G, Betsholtz C (2011) Pericytes: developmental, physiological, and pathological perspectives, problems, and promises. Dev Cell 21:193–215. 10.1016/j.devcel.2011.07.001 - PubMed
    1. Banks WA, Rhea EM (2021) The Blood-Brain barrier, oxidative stress, and insulin resistance. Antioxid (Basel) 10. 10.3390/antiox10111695 - PMC - PubMed
    1. Bartzokis G (2011) Alzheimer’s disease as homeostatic responses to age-related Myelin breakdown. Neurobiol Aging 32:1341–1371. 10.1016/j.neurobiolaging.2009.08.007 - PMC - PubMed

MeSH terms

Substances

LinkOut - more resources