. 2025 Jul 4;23(1):742.
doi: 10.1186/s12967-025-06554-8.

Uncovering key markers and therapeutic targets for renal fibrosis in diabetic kidney disease through bulk and single-cell RNA sequencing

Affiliations

Uncovering key markers and therapeutic targets for renal fibrosis in diabetic kidney disease through bulk and single-cell RNA sequencing

Lijuan Li et al. J Transl Med. .

Abstract

Background: Diabetic kidney disease (DKD) is the major cause of chronic kidney failure, with tubulointerstitial fibrosis playing a crucial role in disease development. Identifying fibrosis-related genes is crucial for improving diagnosis and developing novel therapies due to the necessity for early detection and effective treatments.

Methods: Genes associated with fibrosis were identified by WGCNA, and a FibrosisScore model was constructed based on ssGSEA scores from two DKD datasets. Essential genes were subsequently confirmed by machine learning and single-cell RNA sequencing (scRNA-seq). Potential therapeutic compounds were identified by screening the ZINC database and confirmed via molecular docking. Critical genes involved in renal fibrosis were analyzed in a streptozotocin (STZ)-induced mouse model of DKD, alongside clinical data from the Nephroseq V5 database.

Results: The FibrosisScore model exhibited strong predictive accuracy in both training and validation datasets (AUCs: 0.803, 0.992, 0.891). Patients classified as high-risk demonstrated an increase in M2 macrophages, whereas those identified as low-risk presented a higher prevalence of pro-inflammatory cells. PROM1 and THY1 were recognized as key genes associated with fibrosis. Single-cell RNA analysis revealed that PROM1 is predominantly expressed in proximal tubule cells, while THY1 is enriched in fibroblasts, indicating their distinct roles in fibrosis progression, with both genes exhibiting high diagnostic accuracy (AUC > 0.9). Immune infiltration analysis of PROM1 was primarily associated with a pro-fibrotic, immunosuppressive environment, while THY1 demonstrated antifibrotic properties. ZINC402830 and ZINC3830400 were screened from the ZINC database and validated through molecular docking. In the STZ mouse model, PROM1 correlated with fibrosis and diminished renal function, whereas THY1 exhibited protective effects.

Conclusion: PROM1 and THY1 were critical diagnostic biomarkers for renal fibrosis in DKD, with PROM1 promoting kidney fibrosis and THY1 providing protective effects. The FibrosisScore model demonstrated robust predictive performance, and molecular docking revealed potential therapeutic modulators for these targets.

Keywords: Biomarkers; Diabetic kidney disease; Molecular docking; PROM1; Renal fibrosis; STZ model; Single-cell RNA sequencing; THY1.


Conflict of interest statement

Declarations. Ethics approval and consent to participate: The experiments conducted in this research were reviewed and authorized by the Ethics Committee of Zhongnan Hospital at Wuhan University (Ethical Clearance: ZN2024016). Competing interests: None.

Figures
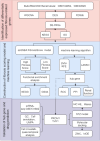
Fig. 1
Fig. 1
Schematic representation of the bioinformatics and machine learning workflow for identifying fibrosis-related hub genes in DKD. DKD: Diabetic kidney disease
Fig. 2
Fig. 2
Identification of differentially expressed fibrosis-related genes (DE-FRGs) in DKD. A Soft-thresholding power selection for WGCNA, showing scale independence and mean connectivity. B Module-trait relationships between gene modules and DKD. The blue module shows the strongest positive correlation with DKD. C Correlation between module membership and gene significance in the blue module. D Volcano plot of DEGs between DKD and control samples. E Venn diagram showing overlap between DEGs, fibrosis-related genes, and genes in the WGCNA blue module, identifying 22 DE-FRGs. F Boxplot showing expression of 22 DE-FRGs in control and DKD samples. WGCNA: Weighted Gene Co-expression Network Analysis; DKD: Diabetic Kidney Disease; DE-FRGs: Differentially expressed fibrosis-related genes
Fig. 3
Fig. 3
Functional enrichment analysis of DE-FRGs. A Circular visualization of GO enrichment analysis results for DE-FRGs, BP, CC, and MF. Each segment represents a specific GO term, with color intensity indicating the level of significance. B Summary table of selected enriched GO terms associated with DE-FRGs, including their ontology category, unique identifiers (IDs), and descriptions. C Circular visualization of KEGG pathway enrichment analysis for DE-FRGs. D Summary table of significant KEGG pathways associated with DE-FRGs, providing pathway IDs and descriptions. DE-FRGs: differentially expressed fibrosis-related genes; GO: Gene Ontology; KEGG: Kyoto Encyclopedia of Genes and Genomes; BP: Biological Process; CC: Cellular Component, MF: Molecular Function
Fig. 4
Fig. 4
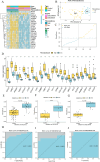
Evaluation of FibrosisScore and its predictive value in DKD. A Expression profiles of high-risk and low-risk groups based on the FibrosisScore were constructed using two cohorts (GSE104954 and GSE30529). Genes associated with fibrosis are shown, with intensity reflecting FibrosisScore levels. B PCA plot illustrating the separation between high-risk and low-risk groups based on FibrosisScore. C FibrosisScore distribution in DKD patients, with high-risk and low-risk groups clearly distinguished. D Boxplot showing significant differences in expression levels of 22 fibrosis-related genes between high-risk and low-risk groups. Statistical significance is indicated. EG Boxplots comparing FibrosisScore distribution between control and DKD samples across three independent validation sets (GSE30122, GSE30529, GSE104948). HJ ROC curves for the validation sets (GSE30122, GSE30529, GSE104948), showing predictive performance of the FibrosisScore model. DKD: diabetic kidney disease; PCA: Principal Component Analysis; ROC: Receiver Operating Characteristic; AUC: Area Under the Curve. (**p < 0.01; ***p < 0.001)
Fig. 5
Fig. 5
Immune cell infiltration and pathway enrichment analysis between high and low FibrosisScore groups. A Boxplot comparing the infiltration levels of various immune cell types between high and low FibrosisScore groups. B Correlation heatmap showing the relationship between immune cell types and FibrosisScore. C Network plot illustrating significant immune cell interactions in high and low FibrosisScore groups, with bubble size representing the degree of enrichment and color indicating error rates. D Heatmap of hallmark pathway enrichment in high and low FibrosisScore groups across different datasets (GSE104954, GSE30529). (***p < 0.001, **p < 0.01, *p < 0.05, ns = not significant)
Fig. 6
Fig. 6
Selection of key fibrosis-related genes using LASSO and Random Forest models. A Plot of the LASSO coefficient profiles for various fibrosis-related genes as a function of the log(λ) (regularization parameter). The vertical dashed line indicates the optimal log(λ) selected based on minimal cross-validated error. B Coefficient trajectories for fibrosis-related genes, illustrating the effect of varying L1 norm penalties on coefficient shrinkage. C Error rate plot from the Random Forest model indicating optimal parameter settings, where the black line shows the mean error rate across trees, and the red dashed line indicates the optimal number of trees. D Variable importance plot from the Random Forest analysis, displaying the MeanDecreaseGini scores for each gene. Genes are ranked based on their importance in predicting fibrosis. E Venn diagram illustrating the overlap between key genes identified by LASSO and Random Forest. LASSO: Least Absolute Shrinkage and Selection Operator; RF: Random Forest; Gini, Gini impurity measure
Fig. 7
Fig. 7
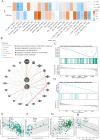
Analysis of gene-immune cell correlations and pathway enrichment associated with Key FRGs. A Heatmap depicting the correlation between expression levels of PROM1 and THY1 and various immune cell types. Significant correlations are indicated by asterisks. B Interaction network illustrating physical and functional interactions between PROM1 and THY1 with other genes, categorized by network type. Key networks include leukocyte activation and regulation of calcium ion concentration. C Enrichment plot for the ECM receptor interaction pathway, showing normalized enrichment scores (NES) and significance. The distribution of genes in the ranked list is presented. D Enrichment plot for the RORA activates gene expression pathway, displaying NES and significance. The ranked list metric is also shown. EH Scatter plots showing the correlation between PROM1 and THY1 expression levels with clinical parameters. Correlation coefficients (r) and significance values (p) are provided for each analysis, demonstrating the relationships with GFR (E, G) and serum creatinine levels (F, H). GFR: Glomerular Filtration Rate; ECM: Extracellular Matrix; NES: Normalized Enrichment Score. (***p < 0.001, **p < 0.01, *p < 0.05)
Fig. 8
Fig. 8
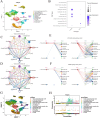
Cellular communication and pseudotime analysis in DKD. A UMAP plot showing the distribution of kidney cell types. B Dot plot highlighting the expression of Key FRGs across different cell types. C Circular network diagram illustrating significant cell–cell communication interactions. E Collagen signaling pathway network. F Laminin signaling pathway network. G UMAP projection showing pseudotime trajectories of kidney cells. H Pseudotime plots for Key FRGs expression during DKD progression. UMAP: Uniform Manifold Approximation; DKD: Diabetic Kidney Disease
Fig. 9
Fig. 9
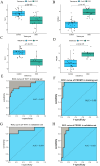
Expression levels and diagnostic performance of key FRGs in DKD. A Boxplot comparing THY1 expression levels between control and DKD groups in the training set. B Boxplot of PROM1 expression in the training set. C Boxplot of THY1 expression in the independent validation set (GSE30122). D Boxplot of PROM1 expression in the validation set. E, F ROC curves for THY1 and PROM1 in the training set. G, H ROC curves for THY1 and PROM1 in the validation set. DKD: diabetic kidney disease; ROC: Receiver Operating Characteristic; AUC: Area Under the Curve
Fig. 10
Fig. 10
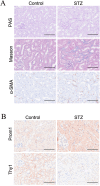
Histological and immunohistochemical analysis of kidney tissues from control and STZ-induced DKD mice. A PAS and Masson staining show increased glomerular damage and fibrosis in the STZ-treated group compared to controls. Immunohistochemical staining for α-SMA highlights increased fibrotic activity in the STZ group. Scale bars: 100 μm. B Immunohistochemical staining for PROM1 and THY1 shows upregulation of PROM1 and downregulation of THY1 in the STZ group compared to controls. Scale bars: 100 μm. STZ: streptozotocin; PAS: Periodic acid-Schiff; α-SMA: alpha-smooth muscle actin
Fig. 11
Fig. 11
Molecular docking of PROM1 and THY1 with ZINC compounds. A PROM1-ZINC402830 complex, showing strong binding affinity. B THY1-ZINC3830400 complex, demonstrating significant binding potential

References

    1. Forbes JM, Thorburn DR. Mitochondrial dysfunction in diabetic kidney disease. Nat Rev Nephrol. 2018;14(5):291–312. 10.1038/nrneph.2018.9. - PubMed
    1. van Raalte DH, Bjornstad P, Cherney DZI, de Boer IH, Fioretto P, Gordin D, et al. Combination therapy for kidney disease in people with diabetes mellitus. Nat Rev Nephrol. 2024;20(7):433–46. 10.1038/s41581-024-00827-z. - PubMed
    1. Naaman SC, Bakris GL. Diabetic nephropathy: update on pillars of therapy slowing progression. Diabet Care. 2023;46(9):1574–86. 10.2337/dci23-0030. - PMC - PubMed
    1. Doshi SM, Friedman AN. Diagnosis and management of type 2 diabetic kidney disease. Clin J Am Soc Nephrol CJASN. 2017;12(8):1366–73. 10.2215/cjn.11111016. - PMC - PubMed
    1. Lin M, Yiu WH, Wu HJ, Chan LY, Leung JC, Au WS, et al. Toll-like receptor 4 promotes tubular inflammation in diabetic nephropathy. J Am Soc Nephrol. 2012;23(1):86–102. 10.1681/asn.2010111210. - PMC - PubMed