. 2025 Nov;94(5):2057-2070.
doi: 10.1002/mrm.30624. Epub 2025 Jul 4.

Development of an echo-shifted, multi-echo, gradient-echo sequence for T2* quantification of slow-relaxing water pools

Affiliations

Development of an echo-shifted, multi-echo, gradient-echo sequence for T2* quantification of slow-relaxing water pools

Seonyeong Shin et al. Magn Reson Med. 2025 Nov.

Abstract

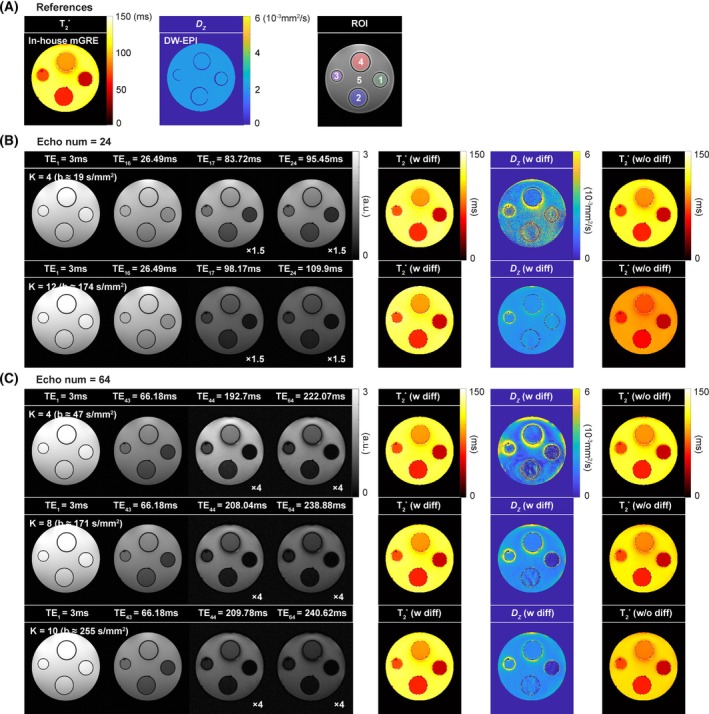
Purpose: Although conventional multi-echo gradient-echo (GRE) sequences effectively quantify short and intermediate T2* in brain tissue, and general interest in cerebrospinal fluid (CSF) is growing due to its association with the glymphatic system, quantifying T2* in CSF remains underexplored. Accurate quantification of the slow-relaxing water pools requires imaging at long echo times, significantly increasing acquisition time. This study proposes a novel sequence capable of quantifying the entire range of T2* without prolonged acquisition time, mapping T2* in both CSF and brain tissue.

Methods: The proposed echo-shifted, multi-echo GRE (ES-mGRE) combines the conventional multi-echo GRE sequence with an echo-shifting technique. Additional gradients are introduced, producing echoes in the next sub-repetition time interval.

Results: ES-mGRE generates artifact-free images at both short and long echo times without extending acquisition time. Increasing the area of the additional gradients enhances diffusion sensitivity, allowing simultaneous quantification of T2* and D in CSF. The mean T2* of white matter and gray matter is 55.9 ms and 51.5 ms at 3 T, respectively. The mean T2* in the ventricles is 234.5 ms. The simultaneously quantified mean D value of 3.07 μm2/ms is closely aligned with the reference diffusivity.

Conclusion: We demonstrate that the proposed ES-mGRE sequence can effectively quantify the T2* of both CSF and brain tissue while also providing simultaneous diffusion information.

Keywords: T2* relaxation time; diffusivity; echo‐shifting technique; multi‐echo gradient echo; quantitative parameter mapping.


Figures

FIGURE 1
FIGURE 1
(A) Schematic diagram of the proposed echo‐shifted, multi‐echo gradient echo. (B) Corresponding phase plot. (C) Signal decay of gray matter, white matter, and cerebrospinal fluid (CSF). The colored areas indicate the time intervals during which the signals are sampled by the proposed method. The interval in between, where the expected signal decay is indicated with a dotted line, is not sampled. RF, radiofrequency; TE, echo time; TR, repetition time.
FIGURE 2
FIGURE 2
(A) Simulation data sets generated with 64 echoes and K equal to 10. One‐third of the total echoes were shifted. Each small rectangular region illustrates the expected behavior of different brain regions: gray matter (GM), white matter (WM), putamen (Put), globus pallidus (GP), and cerebrospinal fluid (CSF). (B) Plots of the signal decay versus echo time (TE) and b‐value versus TE in the cerebrospinal fluid (CSF) region for 64 echoes and various values of K. The parameter K scales the integral of the echo‐shifting gradients, thereby modulating diffusion sensitivity and signal reduction of the shifted echoes.
FIGURE 3
FIGURE 3
Results of phantom experiments obtained from reference (A) and data sets having 24 (B) and 64 (C) echoes. In (B) and (C), the first two columns show the normal (i.e., unshifted) echo images, whereas the third and fourth columns show the shifted echo images. The fifth to seventh columns depict the calculated quantitative maps with and without considering the diffusion term, respectively. Each row represents the results for different areas of additional gradients. The results with the different number of echoes and K can be found in Figure S3. DW‐EPI, diffusion‐weighted echo‐planar imaging; ROI, region of interest; TE, echo time.
FIGURE 4
FIGURE 4
Results of in vivo experiments obtained using vendor‐implemented Siemens multi‐echo gradient echo (mGRE) (A), in‐house‐implemented mGRE (B), quantitative T2* image, and echo‐shifted, multi‐echo GRE (ES‐mGRE) sequences (C). In (B) and (C), the first and second rows depict the results before and after applying the navigator echo correction, respectively. The first to fourth columns display the acquired images. The yellow arrows indicate the ghost artifacts induced by physiological fluctuations. The derived quantitative maps are presented next to the images. For the in‐house‐implemented mGRE data sets, the T2* values were quantified after retrospectively selecting the images to match the echo time (TE) values of ES‐mGRE (fifth column), as well as considering all acquired TE images (sixth column). In ES‐mGRE, a map that compares corrected Akaike Information Criterion (cAIC) values is also displayed. The areas where the signal model with a diffusion term provides a better fit compared to the model without a diffusion term are indicated by the color green. Otherwise, it is represented by the yellow. DW‐EPI, diffusion‐weighted echo‐planar imaging.
FIGURE 5
FIGURE 5
(A) Brain coverage of in‐house‐implemented multi‐echo gradient echo (mGRE) and echo‐shifted mGRE (ES‐mGRE). (B) Whole‐brain T2* and D z maps obtained from ES‐mGRE.
FIGURE 6
FIGURE 6
Acquired images and calculated quantitative maps when using the data sets with 24 echoes. TE, echo time.

References

    1. Otsuji R, Fujioka Y, Hata N, et al. Liquid biopsy for glioma using cell‐free DNA in cerebrospinal fluid. Cancer. 2024;16:1009. doi: 10.3390/cancers16051009 - DOI - PMC - PubMed
    1. Jessen NA, Munk AS, Lundgaard I, Nedergaard M. The glymphatic system: a beginner's guide. Neurochem Res. 2015;40:2583‐2599. doi: 10.1007/s11064-015-1581-6 - DOI - PMC - PubMed
    1. Hablitz LM, Nedergaard M. The glymphatic system: a novel component of fundamental neurobiology. J Neurosci. 2021;41:7698‐7711. doi: 10.1523/JNEUROSCI.0619-21.2021 - DOI - PMC - PubMed
    1. Klostranec JM, Vucevic D, Bhatia KD, et al. Current concepts in intracranial interstitial fluid transport and the glymphatic system. Part I: Anatomy and physiology. Radiology. 2021;301:502‐514. doi: 10.1148/radiol.2021202043 - DOI - PubMed
    1. Spijkerman JM, Petersen ET, Hendrikse J, Luijten P, Zwanenburg JJM. T2 mapping of cerebrospinal fluid: 3 T versus 7 T. MAGMA. 2018;31:415‐424. doi: 10.1007/s10334-017-0659-3 - DOI - PMC - PubMed