. 2025 Apr;77(4):191-204.
doi: 10.1080/07366205.2025.2527536. Epub 2025 Jul 5.

Assessing the necessity of technical replicates in reverse transcription quantitative PCR

Affiliations

Assessing the necessity of technical replicates in reverse transcription quantitative PCR

Eleni Christoforidou et al. Biotechniques. 2025 Apr.

Abstract

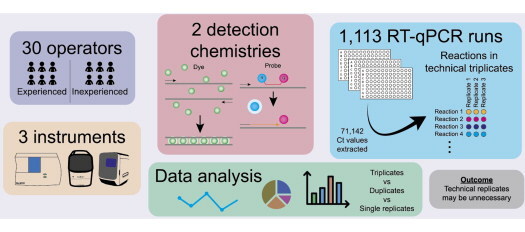
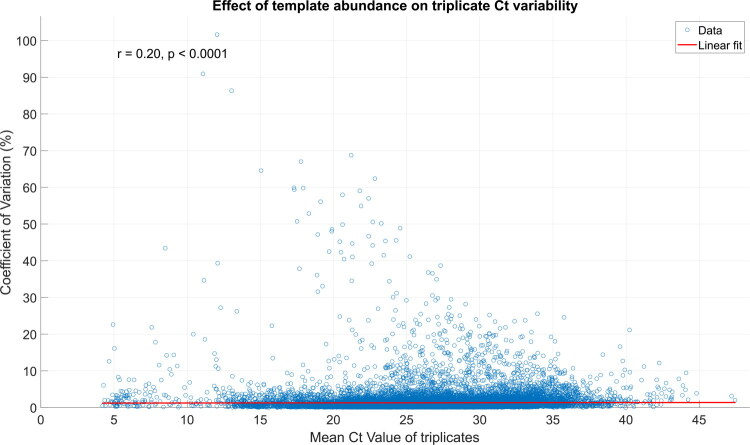
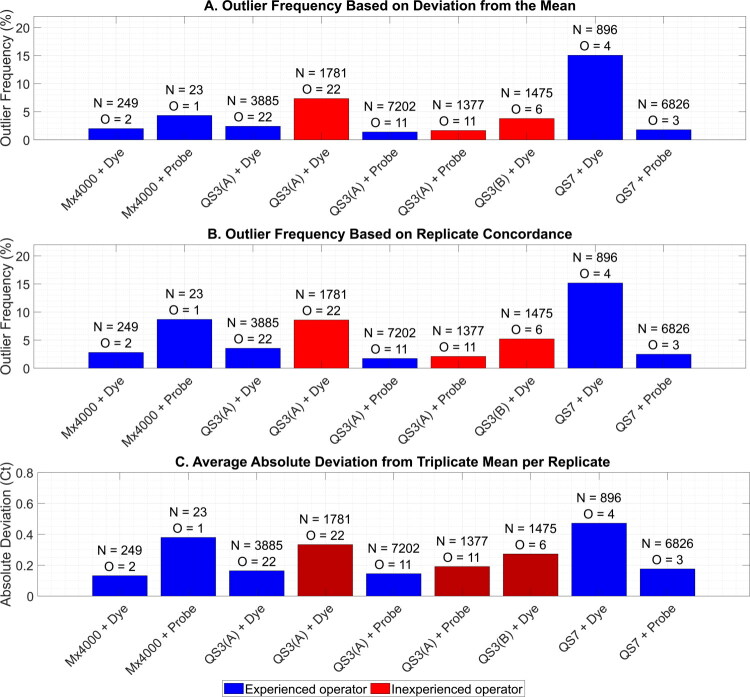
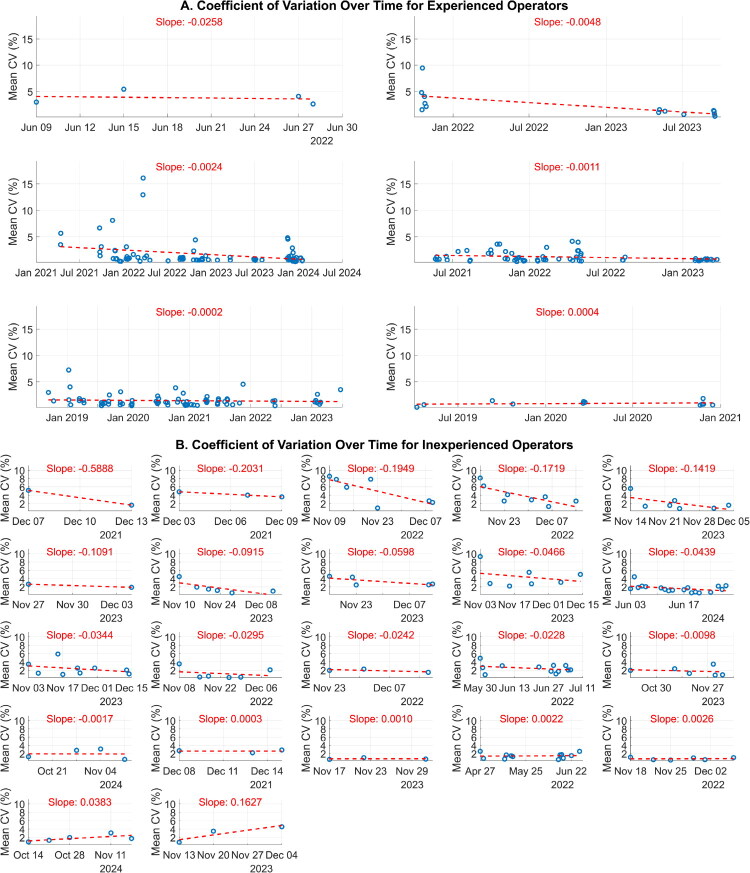
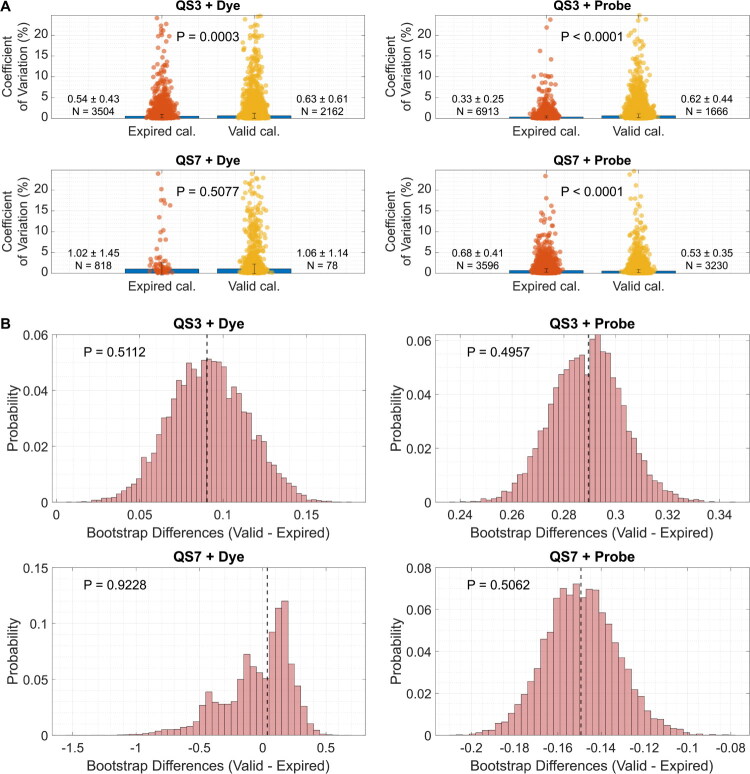
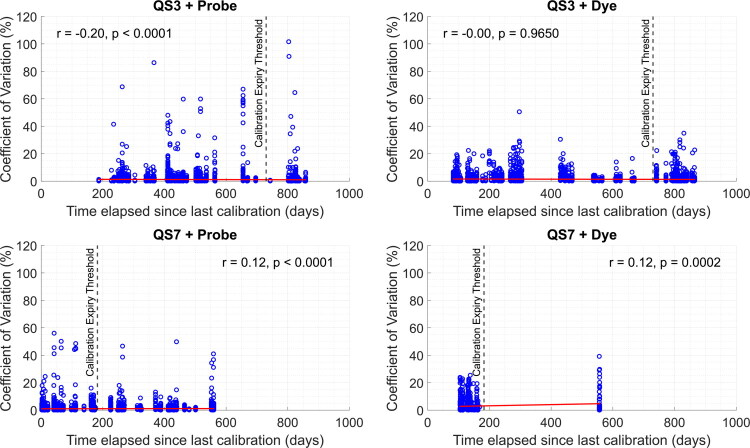
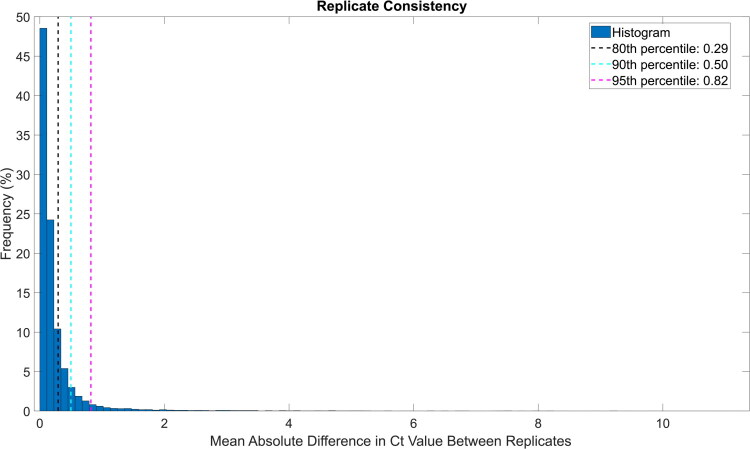
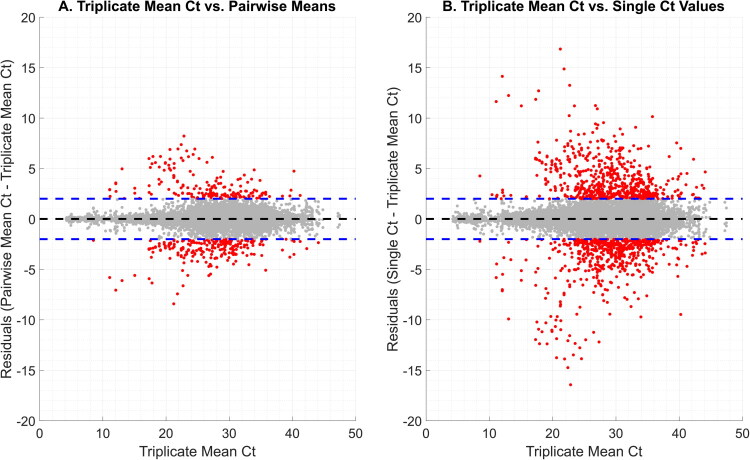
Reverse transcription quantitative polymerase chain reaction (RT-qPCR) is widely used for nucleic acid quantification. The use of technical triplicates in RT-qPCR aims to minimize variability and improve reliability but increases reagent consumption, labor, and time. This study systematically evaluates the necessity of technical replicates by analyzing 71,142 cycle threshold (Ct) values from 1,113 RT-qPCR runs across three instruments, two detection chemistries, and 30 operators. Variability within replicates was assessed using metrics such as the coefficient of variation (CV), while the impacts of operator expertise, detection chemistry, instrument calibration, and initial template concentration were explored. The findings challenge the assumption that variability increases at low template concentrations, revealing no correlation between Ct values and CV. While inexperienced operators exhibited slightly higher variability, their replicates were still consistent, with acceptable CVs and low outlier frequencies. Dye-based detection showed greater variability than probe-based. Time since calibration had negligible effects on replicate consistency. Notably, duplicate or single replicates sufficiently approximated triplicate means. These results challenge traditional assumptions about RT-qPCR variability and provide a data-driven framework for optimizing experimental design. This study offers potential for resource savings without compromising data quality, particularly in high-throughput applications or laboratories with limited funds. The data underlying this article are available at https://doi.org/10.5281/zenodo.15072870.

Keywords: Assay variability; RT-qPCR; high-throughput; qPCR; reverse transcription quantitative PCR; technical replicates.

Plain language summary

We developed an automated method to assess the necessity of technical replicates in RT-qPCR by systematically analyzing cycle threshold (Ct) values obtained from multiple runs, instruments, detection chemistries, and operator groups. The approach calculates variability metrics such as the coefficient of variation and outlier frequency, and directly compares the performance of duplicate and single replicates against standard triplicates.


Conflict of interest statement

The authors have no relevant affiliations or financial involvement with any organization or entity with a financial interest in or financial conflict with the subject matter or materials discussed in the manuscript. This includes employment, consultancies, honoraria, stock ownership or options, expert testimony, grants or patents received or pending, or royalties.

No writing assistance was utilized in the production of this manuscript.

Figures

None
Graphical abstract
Figure 1.
Figure 1.
Correlation between the mean cycle threshold (Ct) value of triplicates (proxy for initial template concentration) and the coefficient of variation between the triplicates. Spearman’s correlation coefficient, r = 0.20, p < 0.0001. The red line represents the linear fit of the data. N = 23,714 mean (from triplicates) Ct values.
Figure 2.
Figure 2.
Outlier frequency within technical triplicate cycle threshold (Ct) values. (A) Outlier frequency based on deviation of each Ct value from the triplicate mean Ct. Outliers were defined as Ct values that deviated from the mean of the triplicates by more than ±2 Ct values. (B) Outlier frequency based on replicate concordance. Outliers were defined as cases where two replicates were closely aligned (difference ≤ 2 Ct), while the third replicate deviated significantly (difference > 2 Ct). (C) Average absolute deviation of each replicate from the mean of the triplicates, per instrument + detection method combination. N-numbers over the bars represent the number of sets of triplicate Ct values analyzed. O-numbers represent the number of operators. QS3, QuantStudio 3; QS7, QuantStudio 7 Flex. “QS3(A)” and “QS3(B)” refer to two separate QS3 machines.
Figure 3.
Figure 3.
Mean coefficient of variation (CV) of triplicate cycle threshold (Ct) values for individual experienced (A) and inexperienced (B) operators over time. The red dashed line represents a linear trendline, and the slope of this line is indicated in red. The subplots are sorted from lowest to highest trendline slope. Two inexperienced operators are not shown, since they collected all their data on the same day.
Figure 4.
Figure 4.
(A) Effect of instrument calibration on triplicate cycle threshold (Ct) variability. Data are shown as median (blue bars) ± interquartile range/2 (error bars), and these values are also indicated next to the bars. Data were analyzed by Wilcoxon rank-sum tests, with the p-values indicated on each subplot. N-numbers next to the bars represent the number of sets of triplicate Ct values analyzed. (B) Bootstrap probability distributions of the differences in medians between the Valid and Expired calibration groups for each instrument and detection method combination. The vertical dashed lines represent the observed difference in medians between the Valid and Expired calibration groups calculated directly from the data in the absence of bootstrapping (these observed medians are displayed in panel A Figure 4). The p-values on each subplot represent the bootstrap-derived probabilities, calculated as the proportion of bootstrap differences as extreme as or more extreme than the observed difference. QS3, QuantStudio 3; QS7, QuantStudio 7 Flex. QS3, QuantStudio 3; QS7, QuantStudio 7 Flex; cal., calibration.
Figure 5.
Figure 5.
Effect of post-calibration instrument stability on cycle threshold (Ct) variability. Spearman’s correlation coefficients (r) and p-values are indicated on each subplot. The red lines represent the linear fit of the data. The black vertical dashed lines indicate the calibration expiry threshold of 2 years (for QS3) or 6 months (for QS7). N = 5666, 8579, 896, and 6826 mean (from triplicates) Ct values for QS3 + Dye, QS3 + Probe, QS7 + Dye, and QS7 + Probe, respectively. QS3, QuantStudio 3; QS7, QuantStudio 7 Flex.
Figure 6.
Figure 6.
Frequency of mean absolute differences between replicates in each set of triplicate cycle threshold (Ct) values. N = 23,714 sets of triplicate Ct values.
Figure 7.
Figure 7.
Residuals of pairwise mean cycle threshold (Ct) values (A) and single Ct values (B) versus the corresponding triplicate mean Ct. The grey points represent the residuals [difference between triplicate mean Ct and either each possible pairwise mean Ct (A) or each single Ct value (B)], while the red dots indicate the residuals where the absolute deviation exceeds a defined threshold (±2 Ct, indicated by the blue horizontal dashed lines). These significant residuals indicate Ct values that deviate substantially from the triplicate mean. The horizontal black dashed line at zero represents perfect agreement, where the residual would be zero. Red points represent 0.59% and 1.73% of the data in panels A and B, respectively. N = 23,714 sets of triplicate Ct values.

Similar articles

References

    1. Kitchen RR, Kubista M, Tichopad A.. Statistical aspects of quantitative real-time PCR experiment design. Methods. 2010;50(4):231–236. doi: 10.1016/j.ymeth.2010.01.025 - DOI - PubMed
    2. • Information on the statistical foundations of qPCR study design, including replicate handling and power analyses.

    1. Taylor S, Wakem M, Dijkman G, et al. A practical approach to RT-qPCR—publishing data that conform to the MIQE guidelines. Methods. 2010;50(4):S1–S5. doi: 10.1016/j.ymeth.2010.01.005 - DOI - PubMed
    2. • Illustrates how everyday laboratory workflows implement the MIQE guidelines, highlighting common reliance on technical triplicates.

    1. Ling D, Pike CJ, Salvaterra PM.. Deconvolution of the confounding variations for reverse transcription quantitative real-time polymerase chain reaction by separate analysis of biological replicate data. Anal Biochem. 2012;427(1):21–25. doi: 10.1016/j.ab.2012.04.029 - DOI - PMC - PubMed
    1. Lazic SE, Clarke-Williams CJ, Munafò MR.. What exactly is ‘N’ in cell culture and animal experiments? PLoS Biol. 2018;16(4):e2005282. doi: 10.1371/journal.pbio.2005282 - DOI - PMC - PubMed
    1. Bustin SA, Benes V, Garson JA, et al. The MIQE guidelines: minimum information for publication of quantitative real-time PCR experiments. Clin Chem. 2009;55(4):611–622. doi: 10.1373/clinchem.2008.112797 - DOI - PubMed
    2. •• Foundational guidelines that set the quality standard for qPCR reporting; it underpins the entire debate about when replicates are needed.

MeSH terms

LinkOut - more resources