

Targeting PFKFB3 to restore glucose metabolism in acute pancreatitis via nanovesicle delivery
- PMID: 40618046
- PMCID: PMC12229013
- DOI: 10.1186/s10020-025-01261-y
Targeting PFKFB3 to restore glucose metabolism in acute pancreatitis via nanovesicle delivery
Abstract
Background: Acute pancreatitis (AP) is a severe inflammatory disease frequently accompanied by disturbances in glucose metabolism, which further complicate the disease prognosis. This study aims to explore the role of PFKFB3, a key glycolytic enzyme, in regulating glucose metabolism in AP and assess the potential of PFKFB3 inhibition via nanovesicle delivery to mitigate metabolic dysfunction.
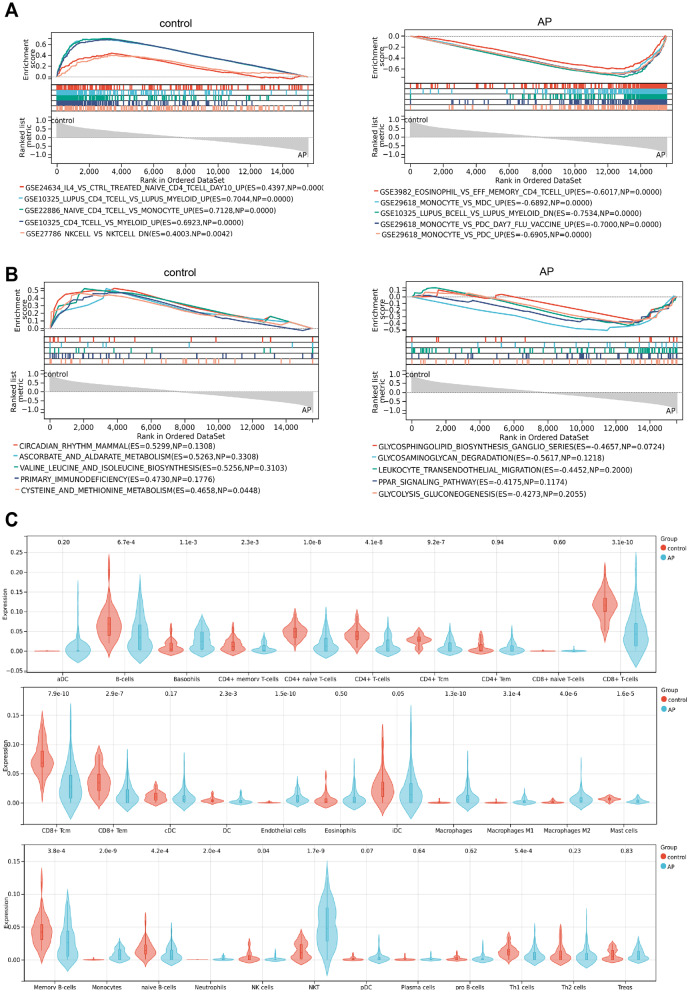
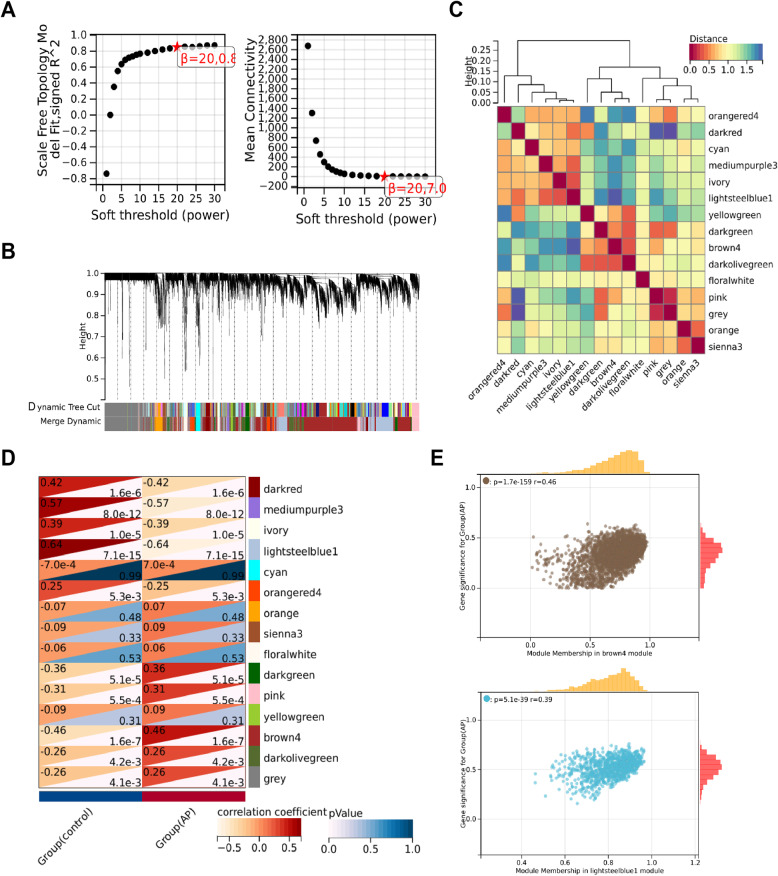
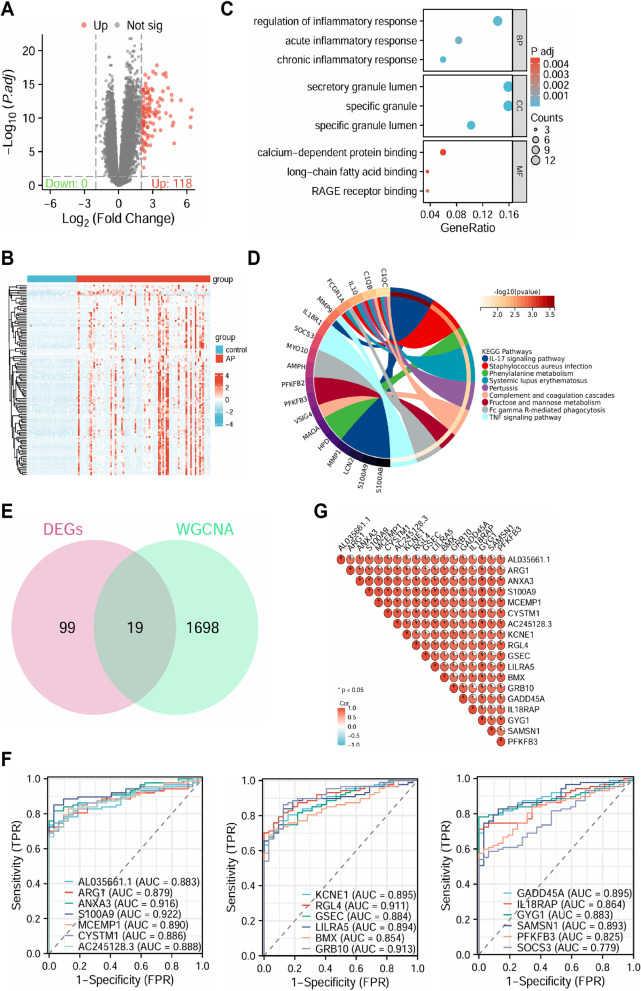
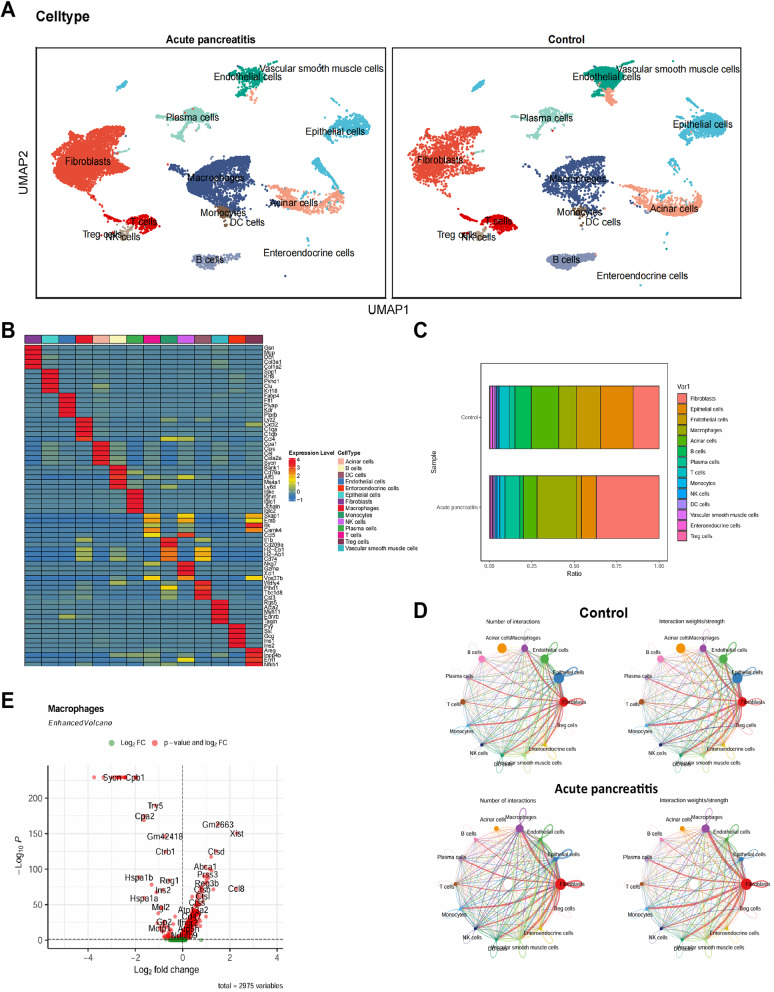
Methods: Transcriptomic data from Gene Expression Omnibus (GEO), including single-cell RNA sequencing (scRNA-seq) and bulk RNA sequencing, were analyzed to investigate the molecular mechanisms involved in glucose metabolism dysregulation in AP. The therapeutic effects of PFKFB3 inhibition via nanovesicle-based delivery were evaluated using both in vivo and in vitro AP models.
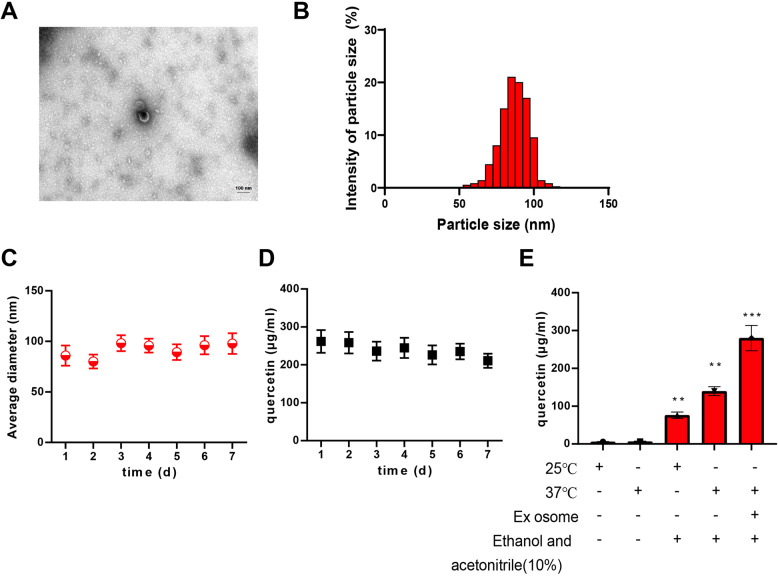
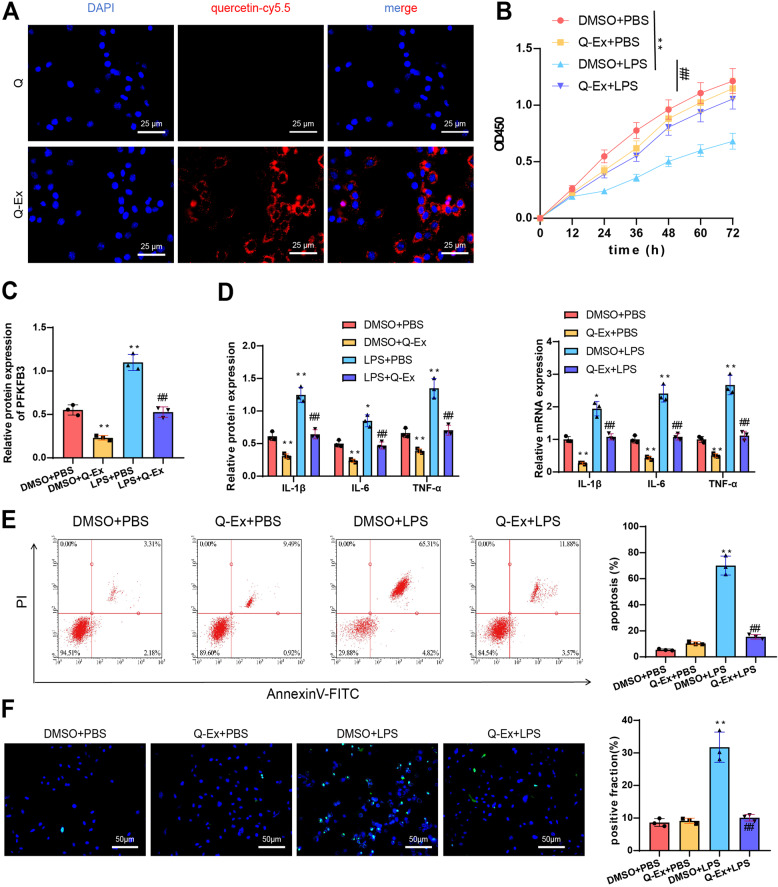
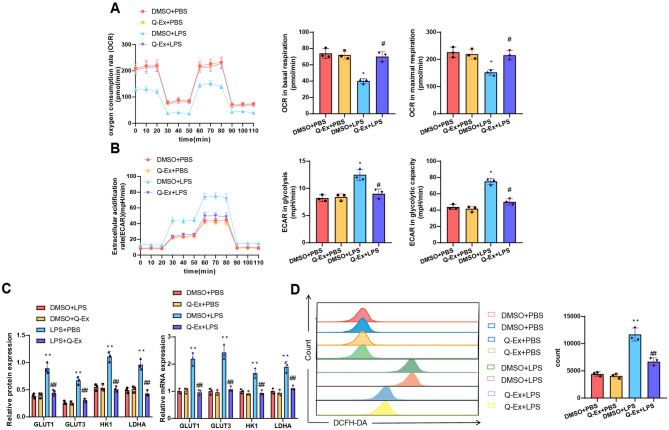
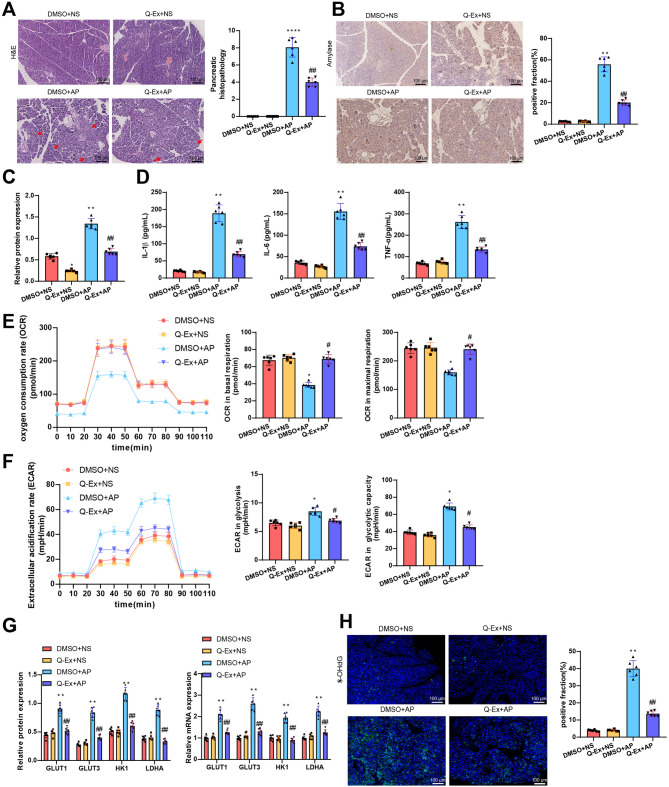
Results: PFKFB3 inhibition significantly restored normal glycolytic function and improved glucose metabolism in AP models. Moreover, nanovesicle-mediated delivery also alleviated both inflammation and metabolic disturbances, highlighting its promise as a therapeutic strategy for managing glucose dysfunction in AP.
Conclusion: Our findings identify PFKFB3 as a critical therapeutic target for treating glucose metabolism disorders in acute pancreatitis. Nanovesicle-based PFKFB3 inhibition may serve as an innovative approach to address metabolic complications associated with AP, offering a new direction for therapeutic interventions in inflammatory diseases.
Keywords: Acute pancreatitis; Glucose metabolism disorder; Machine learning; Nanovesicles; PFKFB3 inhibitor; Single-cell RNA sequencing.
© 2025. The Author(s).
Conflict of interest statement
Declarations. Ethics approval and consent to participate: All animal experiments were approved by the Animal Ethics Committee of Bengbu Medical University. Consent for publication: Not applicable. Competing interests: The authors declare no competing interests.
Figures
Similar articles
-
Glycolytic PFKFB3 and Glycogenic UGP2 Axis Regulates Perfusion Recovery in Experimental Hind Limb Ischemia.Arterioscler Thromb Vasc Biol. 2024 Aug;44(8):1764-1783. doi: 10.1161/ATVBAHA.124.320665. Epub 2024 Jun 27. Arterioscler Thromb Vasc Biol. 2024. PMID: 38934117 Free PMC article.
-
Metabolic adaptation to acute metabolic stress via PFKFB3 upregulation in rodent beta cells.Front Endocrinol (Lausanne). 2025 Jun 17;16:1552700. doi: 10.3389/fendo.2025.1552700. eCollection 2025. Front Endocrinol (Lausanne). 2025. PMID: 40600018 Free PMC article.
-
Geniposide Improves Glycolysis Driven Angiogenesis in Experimentary Arthritis by Inhibiting SphK1-PI3K-Akt-PFKFB3 Signal.Phytother Res. 2025 Aug;39(8):3419-3431. doi: 10.1002/ptr.70019. Epub 2025 Jun 30. Phytother Res. 2025. PMID: 40583637
-
The Black Book of Psychotropic Dosing and Monitoring.Psychopharmacol Bull. 2024 Jul 8;54(3):8-59. Psychopharmacol Bull. 2024. PMID: 38993656 Free PMC article. Review.
-
Systemic pharmacological treatments for chronic plaque psoriasis: a network meta-analysis.Cochrane Database Syst Rev. 2021 Apr 19;4(4):CD011535. doi: 10.1002/14651858.CD011535.pub4. Cochrane Database Syst Rev. 2021. Update in: Cochrane Database Syst Rev. 2022 May 23;5:CD011535. doi: 10.1002/14651858.CD011535.pub5. PMID: 33871055 Free PMC article. Updated.
References
-
- Boxhoorn L, van Dijk SM, van Grinsven J, et al. Immediate versus postponed intervention for infected necrotizing pancreatitis. N Engl J Med. 2021;385(15):1372–81. 10.1056/NEJMoa2100826. - PubMed
-
- Cai W, Cheng J, Zong S, et al. The Glycolysis inhibitor 2-deoxyglucose ameliorates adjuvant-induced arthritis by regulating macrophage polarization in an AMPK-dependent manner. Mol Immunol. 2021;140:186–95. 10.1016/j.molimm.2021.10.007. - PubMed
MeSH terms
Substances
Grants and funding
- AHWJ2023A20220/Provincial Financial Support Program/General Program
- AHWJ2023A20220/Provincial Financial Support Program/General Program
- AHWJ2023A20220/Provincial Financial Support Program/General Program
- AHWJ2023A20220/Provincial Financial Support Program/General Program
- AHWJ2023A20220/Provincial Financial Support Program/General Program
- AHWJ2023A20220/Provincial Financial Support Program/General Program
- AHWJ2023A20220/Provincial Financial Support Program/General Program
- AHWJ2023A20220/Provincial Financial Support Program/General Program
- AHWJ2023A20220/Provincial Financial Support Program/General Program
- AHWJ2023A20220/Provincial Financial Support Program/General Program
- No. 2024AH051287/Scientific Research Project of Higher Education Institutions in Anhui Province
- No. 2024AH051287/Scientific Research Project of Higher Education Institutions in Anhui Province
- No. 2024AH051287/Scientific Research Project of Higher Education Institutions in Anhui Province
- No. 2024AH051287/Scientific Research Project of Higher Education Institutions in Anhui Province
- No. 2024AH051287/Scientific Research Project of Higher Education Institutions in Anhui Province
- No. 2024AH051287/Scientific Research Project of Higher Education Institutions in Anhui Province
- No. 2024AH051287/Scientific Research Project of Higher Education Institutions in Anhui Province
- No. 2024AH051287/Scientific Research Project of Higher Education Institutions in Anhui Province
- No. 2024AH051287/Scientific Research Project of Higher Education Institutions in Anhui Province
- No. 2024AH051287/Scientific Research Project of Higher Education Institutions in Anhui Province
- No. AHWJ2023A20220/Anhui Provincial Financial Support Project / General Project
- No. AHWJ2023A20220/Anhui Provincial Financial Support Project / General Project
- No. AHWJ2023A20220/Anhui Provincial Financial Support Project / General Project
- No. AHWJ2023A20220/Anhui Provincial Financial Support Project / General Project
- No. AHWJ2023A20220/Anhui Provincial Financial Support Project / General Project
- No. AHWJ2023A20220/Anhui Provincial Financial Support Project / General Project
- No. AHWJ2023A20220/Anhui Provincial Financial Support Project / General Project
- No. AHWJ2023A20220/Anhui Provincial Financial Support Project / General Project
- No. AHWJ2023A20220/Anhui Provincial Financial Support Project / General Project
- No. AHWJ2023A20220/Anhui Provincial Financial Support Project / General Project
LinkOut - more resources
Full Text Sources
Medical
