. 2025 Jul 5;22(1):174.
doi: 10.1186/s12974-025-03502-7.

LAG3 limits regulatory T cell proliferation in α-synuclein gut-to-brain transmission model

Affiliations

LAG3 limits regulatory T cell proliferation in α-synuclein gut-to-brain transmission model

Wei-Xin Kong et al. J Neuroinflammation. .

Abstract

Background: Pathological α-synuclein (α-syn) can spread from the gut to the central nervous system (CNS), with CD4 + T cells playing a key role in this process. Lymphocyte activation gene 3 (LAG3) is involved in intestinal inflammation, regulates CD4 + T cell proliferation and function, and can specifically bind to pathological α-syn during cell-to-cell transmission. However, it remains unclear whether LAG3 is involved in the spread of pathological α-syn from the gut to the brain.

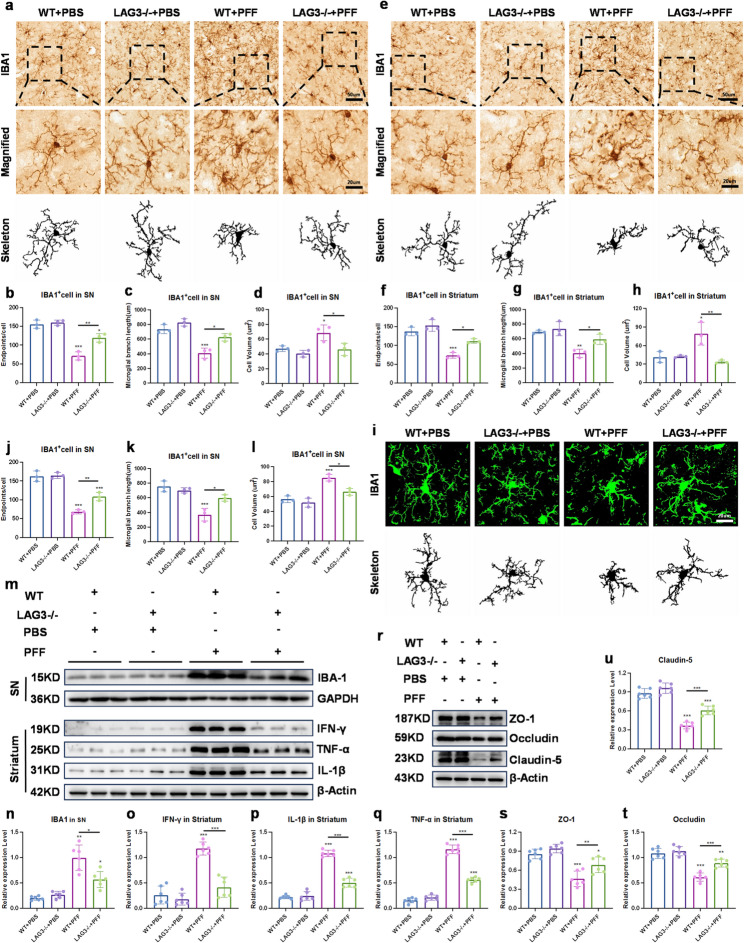
Methods: We utilized LAG3 knockout mice, combined with injection of α-syn preformed fibril (PFF) into the longitudinal and intermediate muscle layers of the pylorus and duodenum to model Parkinson's disease (PD). We used Immunohistochemistry staining, Western Blot, Flow cytometry to detect the changes of TH, α-syn, pro-inflammatory factors, barrier-related proteins and CD4 + T cells differentiation.

Results: Our results show that LAG3 knockout partially alleviates psychological and behavioral deficits, dopamine system damage, and the gut-to-brain transmission of α-syn, which correlates with enhanced regulatory T cell (Treg) cell proliferation. Furthermore, LAG3 knockout improved intestinal dysfunction and increased the expression of tight junction proteins in both the gut and the blood-brain barrier (BBB). In CD4 + T cells isolated from the spleen, LAG3 knockout suppressed the aggregation of α-syn PFF, thereby inhibiting the toxic T-cell response induced by α-syn PFF. LAG3 deficiency also enhanced the IL-2/STAT5 signaling pathway, which regulates Treg proportions both in vivo and in vitro.

Conclusions: Our findings demonstrated that LAG3 intrinsically limits Treg cell proliferation and function in the environment with pathological α-syn and promotes the gut-to-brain transmission of α-syn.

Keywords: Alpha-synuclein; Gut to brain transmission; LAG3; Parkinson's disease; Preformed fibril; Regulatory T cell.


Conflict of interest statement

Declarations. Ethics approval and consent to participate: All animal experimental procedures were approved by the Institutional Animal Care and Use Committee of the First Affiliated Hospital of Guangzhou Medical University. Competing interests: The authors declare no competing interests.

Figures

Fig. 1
Fig. 1
LAG3-deletion ameliorates motor dysfunction, DA neuron degeneration and α-syn pathology after PFF injection. a Experimental design in PFF-injected mice. b Representative traces of the open field test. c-e Time spent in the center zone, travel paths in the center zone and total travel distance in the open field. f Pole-climbing time in the pole-climbing test. n = 11,10,9,11 for PBS-injected WT group, PBS-injected LAG3-/- group, PFF-injected WT group and PFF-injected LAG3-/- group respectively. g-i Immunohisto-chemistry staining and quantification of TH-positive cells in SNpc and TH-positive density in the striatum. n = 3 per group. j-o Representative blots and quantification of TH, total α-synuclein and phosphorylated α-synuclein (Ser129) in the SN and gut. p and q Representative blots showing the expression of SDS-soluble α-syn in the striatum and gut. n = 6 per group. Results are expressed as the mean ± SD. ***p < 0.001, **p < 0.01, *p < 0.05. Statistical significance was determined using one-way ANOVA and Tukey’s test for post hoc comparisons
Fig. 2
Fig. 2
LAG3 knockout inhibits inflammatory response and barrier damage in the brain. a-d Immunohisto-chemistry staining and quantification of endpoints, branch length and cellular volume of IBA-1 + cell in the SN. e-h Immunohisto-chemistry staining and quantification of endpoints, branch length and cellular volume of IBA-1 + cell in the striatum. i-l Immunofluorescence staining and quantification of endpoints, branch length and cellular volume of IBA-1 + cell in the SN. n = 3 per group. m-q Representative blots and quantification of IBA-1 in the SN and IL-1β, TNF-α and IFN-γ in the striatum. n = 6 per group. r-u Representative blots and quantification of ZO-1, Occludin and Claudin-5 in the brain. n = 6 per group. Results are expressed as the mean ± SD. ***p < 0.001, **p < 0.01, *p < 0.05. Statistical significance was determined using one-way ANOVA and Tukey’s test for post hoc comparisons
Fig. 3
Fig. 3
The deletion of LAG3 alleviates gastrointestinal dysfunction. a Diagram showing the process of gastrointestinal function assessment test. b-d Pellet number, total pellet weight and time to first pellet in gastrointestinal function assessment test. n = 6 per group. e-h Representative blots and quantification of IL-1β, TNF-α and IFN-γ in the gut. n = 6 per group. i-l Representative blots and quantification of ZO-1, Occludin and Claudin-1 in the gut. n = 6 per group. m-r Immunohisto-chemistry staining and quantification of ZO-1, Occludin and Claudin-1 in the gut. n = 6 per group for ZO-1 and Occludin, n = 3 per group for Claudin-1. Results are expressed as the mean ± SD. ***p < 0.001, **p < 0.01, *p < 0.05. Statistical significance was determined using one-way ANOVA and Tukey’s test for post hoc comparisons
Fig. 4
Fig. 4
Lack of LAG3 on T cell improves the percentage of Treg. a Representative diagrams of the flow cytometry gating strategy for CD4 + T cell, Treg, Th17 and Th1. b Representative scatter diagrams of the percentage of Treg, Th17 and Th1 in the ILP and spleen. c and d Quantitative analysis of the percentage of Treg in the ILP and spleen. n = 6 per group. e and f Quantitative analysis of the percentage of Th17 in the ILP and spleen. n = 6 per group. g and h Quantitative analysis of the percentage of Th1 in the ILP and spleen. n = 6 per group. Results are expressed as the mean ± SD. ***p < 0.001, **p < 0.01, *p < 0.05. Statistical significance was determined using one-way ANOVA and Tukey’s test for post hoc comparisons
Fig. 5
Fig. 5
LAG3 knockout on T cell suppresses PFF transmission by promoting Treg cell proliferation. a-d Representative scatter diagrams and quantitative analysis of the percentage of Treg, Th17 and Th1. n = 6 per group. e-g Representative scatter diagrams and quantitative analysis of Brdu-labeled Tregs. n = 6 per group. h and i Representative blots and quantification of SDS-soluble α-syn in the CD4 + T cells after PFF treatment. n = 5 per group. j and k Representative blots and quantification of SDS-soluble α-syn in the CD4 + T cells after PFF treatment. n = 6 per group. Results are expressed as the mean ± SD. ***p < 0.001, **p < 0.01, *p < 0.05. Statistical significance was determined using one-way ANOVA and Tukey’s test for post hoc comparisons
Fig. 6
Fig. 6
LAG3 knockout regulates the Treg cell function via IL2/STAT5 pathways. Representative blots and quantification of IL-2, JAK-1/p-JAK-1 and STAT5/p-STAT5. a-d Representing CD4 + T cell after PFF treatment. e-h Representing ILP. i-l Representing spleen. n = 6 per group. Results are expressed as the mean ± SD. ***p < 0.001, **p < 0.01, *p < 0.05. Statistical significance was determined using one-way ANOVA and Tukey’s test for post hoc comparisons

References

    1. Kalia LV, Lang AE. Parkinson’s disease. Lancet. 2015;386(9996):896–912. - PubMed
    1. Braak H, de Vos RA, Bohl J, Del Tredici K. Gastric alpha-synuclein immunoreactive inclusions in meissner’s and auerbach’s plexuses in cases staged for parkinson’s disease-related brain pathology. Neurosci Lett. 2006;396(1):67–72. - PubMed
    1. Kim S, Kwon SH, Kam TI, et al. Transneuronal propagation of pathologic α-Synuclein from the gut to the brain models parkinson’s disease. Neuron. 2019;103(4):627–e6417. - PMC - PubMed
    1. Chen QQ, Haikal C, Li W, Li JY. Gut inflammation in association with pathogenesis of parkinson’s disease. Front Mol Neurosci. 2019;12:218. Published 2019 Sep 13. - PMC - PubMed
    1. Li Y, Chen Y, Jiang L, et al. Intestinal inflammation and parkinson’s disease. Aging Dis. 2021;12(8):2052–68. Published 2021 Dec 1. - PMC - PubMed

LinkOut - more resources