. 2025 Jul 4:S0168-8278(25)02320-7.
doi: 10.1016/j.jhep.2025.06.021. Online ahead of print.

Somatic loss-of-function mutations in CIDEB reduce hepatic steatosis by increasing lipolysis and fatty acid oxidation

Affiliations

Somatic loss-of-function mutations in CIDEB reduce hepatic steatosis by increasing lipolysis and fatty acid oxidation

Qiyu Zeng et al. J Hepatol. .

Abstract

Background & aims: Somatic and germline CIDEB mutations are associated with protection from chronic liver diseases. The mechanistic basis and whether CIDEB suppression would be an effective therapy against fatty liver disease remain unclear.

Methods: Twenty-one CIDEB somatic mutations were introduced into cells to assess functionality. In vivo screening was used to trace Cideb mutant clones in mice fed normal chow, western diet (WD), and choline-deficient, L-amino acid-defined, high-fat diet (CDA-HFD) diets. Constitutive and conditional Cideb knockout mice were generated to study Cideb in liver disease. Isotope tracing was used to evaluate fatty acid oxidation and de novo lipogenesis. Transcriptomics, lipidomics, and metabolic analyses were utilized to explore molecular mechanisms. Double knockout models (Cideb/Atgl and Cideb/Pparα) tested mechanisms underlying Cideb loss.

Results: Most CIDEB mutations impaired function, and loss-of-function clones were positively selected under CDA-HFD but not all steatogenic diets. Cideb knockout mice were protected from WD-, CDA-HFD-, and alcohol-induced liver disease, with the strongest effect in CDA-HFD models. Hepatocyte-specific Cideb deletion ameliorated disease after MASLD (metabolic dysfunction-associated steatotic liver disease) establishment, modeling the impact of therapeutic small-interfering RNAs. Cideb loss protected livers via increased β-oxidation, specifically through ATGL and PPARα activation.

Conclusions: Cideb deletion is more protective in some types of fatty liver disease. β-oxidation is an important component of the Cideb protective mechanism. CIDEB inhibition represents a promising approach, and somatic mutations in CIDEB might predict the patient populations who will benefit the most.

Impact and implications: It is not clear why somatic and germline CIDEB mutations are protective in metabolic dysfunction-associated steatotic liver disease (MASLD). Cideb mutations are predominantly loss of function, and Cideb-deficient clones selectively expand in specific dietary contexts such as choline-deficient, L-amino acid-defined, high-fat diet-induced MASLD. Consistently, liver-wide deletion of Cideb ameliorates MASLD most profoundly after choline-deficient, L-amino acid-defined, high-fat diet feeding. Mechanistically, Cideb deficiency enhances hepatic fatty acid β-oxidation via ATGL and PPARα activation. These findings suggest that CIDEB inhibition might be most effective in patients with the subtypes of MASLD that promote the expansion of CIDEB mutant clones.

Keywords: CIDEB; fatty liver disease; in vivo screening; somatic mutations; β-oxidation.


Conflict of interest statement

Conflict of interest H.Z. and P.C. are co-founders of Quotient Therapeutics and Jumble Therapeutics. H.Z. is an advisor for Newlimit, Alnylam Pharmaceuticals, and Chroma Medicines. H.Z. received research support from Chroma Medicines and owns stock in Ionis Pharmaceuticals. H.Z. and L.L. have a patent on CIDEB siRNA for liver disease (patent #63/328,557). Please refer to the accompanying ICMJE disclosure forms for further details.

Figures

Graphical Abstract
Graphical Abstract
Fig. 1
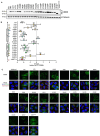
Fig. 1. Impact of somatic CIDEB mutations on expression and LD enlargement.
(A) Western blot analysis in oleate-loaded HeLa cells transfected with CIDEB. This blot is representative of 3 independent experiments. (B) Quantification of LD volume in oleate-loaded HeLa cells transfected with CIDEB mutants. Enlargement activity is represented as a Z-score where 0 is WT CIDEB (C) Representative images of LDs (red) and CIDEB (green) in oleate-loaded HeLa cells transfected with CIDEB. Nuclei were stained with DAPI (blue). Data are presented as mean ± SEM. Statistical analysis was performed using one-way ANOVA followed by Tukey's post hoc test. *p < 0.05, **p < 0.01, ***p < 0.001, ****p < 0.0001, **p < 0.01, N.S., not significant.
Fig. 2
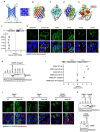
Fig. 2. Disruption of the C-terminal β-sheet and N-terminus helix affects CIDEB-mediated LD enlargement.
(D) AlphaFold prediction of the CIDEB β-sheet aa 127-170 tetramer (left panel). Predicted structure coloured according to predicted local distance difference (Quality parameters displayed below). Predicted aligned error (Å) between residues of the four protomers A to D, coloured according to scale on the left (right panel). Black lines separate the sequences of the monomeric units. (E) Model of CIDEB aa 127-170 forming a hollow β-barrel. The four protomers are rendered in different colors. (F) Surface representation of the external hydrophilic surface of the CIDEB putative channel. (G) Surface representation of the inner hydrophobic surface of the CIDEB putative channel. The two protomers are presented as ribbons to render the interior visible. (H) Surface representation of CIDEB putative channel. F145 (red) and V152 (blue) at the inner surface (two protomers shown). Lipid transfer is suppressed when mutated to D. The residues between the two V152 from two neighbouring protomers are C164 (green contour, Fig. S2). The Intensity of yellow and cyan corresponds to the degree of hydrophobicity and hydrophilicity, respectively. (I) Quantification of LD volume in oleate-loaded HeLa cells transfected with CIDEB β-sheet deletion and point mutants.Enlargement activity is represented as a Z-score where 0 is WT CIDEB (J) Representative images of LDs (red) and CIDEB (green) in oleate-loaded HeLa cells transfected with CIDEB β-sheet deletion and point mutants. Nuclei were stained with DAPI (blue). (K) Western blot analysis in oleate-loaded HeLa cells transfected with CIDEB β-sheet deletion and point mutants. (L) Quantification of LD volume in oleate-loaded HeLa cells transfected with wildtype (WT) or n-terminal helix deleted mutants (aa1-29) of HA-tagged CIDEC, HA-CIDEB or untagged CIDEB. LD enlargement activity is represented as a Z-score where 0 is empty vector (EV). (M) Representative images of LDs (red) and HA (green) or CIDEB (green) in oleate-loaded HeLa cells transfected with wildtype (WT) or n-terminal helix deleted mutants (aa1-29) of HA-tagged CIDEC, HA-CIDEB or untagged CIDEB. Nuclei were stained with DAPI (blue). (N) Western blot analysis in oleate-loaded HeLa cells transfected with HA tagged CIDEC, HA tagged CIDEB, or untagged CIDEB n-terminal helix deleted mutants. Data are presented as mean ± SEM. Statistical analysis was performed using one-way ANOVA followed by Tukey's post hoc test. **p < 0.01, ****p < 0.0001.
Fig. 3
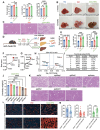
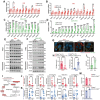
Fig. 3. Positive selection of Cideb loss-of-function clones in two fatty liver models.
(A) Body weight, liver weight, and liver/body weight ratio in WT mice fed with NC, WD, or CDA-HFD for 2 weeks. (B) Representative gross livers treated for 2 and 12 weeks on various diets. (C) Representative H&E staining of livers from Fig. 3A. (D) Schematic of the MOSAICS system. Cas9 was induced in iCas9 male mice using dox (1 mg/mL) from 6.5-8.5 weeks of age. AAV-sgRNA libraries targeting 55 genes were injected at 7.5 weeks of age. Mice were fed with NC, WD, or CDA-HFD for 3 months (n = 10, 10, and 12 mice). Livers were collected for genomic DNA and amplicon sequencing. (E) Body weight, liver weight, and liver/body weight ratio of screening mice from Fig. 3D. (F) β-scores from mice on CDA-HFD versus NC. Positive β-scores indicate sgRNA enrichment in the CDA-HFD group; negative scores indicate sgRNA non-enrichment relative to NC. (G) β-scores from mice on WD versus NC. (H) Volcano plot comparing WD and CDA-HFD, revealing enrichment of sgRNAs against Acaca, Mlxipl, and Pex5 in WD, and Cideb, Srebf1, and Mfn2 in CDA-HFD. (I) Genes associated with sgRNAs in h with significant enrichment (p < 0.05). (J) Cas9 was induced from 6.5-8.5 weeks of age. At 7.5 weeks, mice received a high dose of AAV-sgRNAs to delete genes in the liver. At 8.5 weeks, mice were fed CDA-HFD for 3 weeks. Liver/body weight ratios shown. (K) H&E staining of livers from Fig. 3J. (L) Low dose AAV8-TBG-Cre was used to induce mosaic Tomato labeling and Cideb deletion in hepatocytes. Mice were fed with NC, WD, or CDA-HFD for 3 months. Livers were collected 1 week after AAV injection and after 3 months of diets. Tomato images of liver sections are shown. (M) Tomato+ cell frequency in Fig. 3L. Data are presented as mean ± SEM. Statistical analysis was performed using one-way ANOVA followed by Tukey's post hoc test. *p < 0.05, **p < 0.01, ***p < 0.001, ****p < 0.0001.
Fig. 4
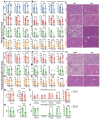
Fig. 4. Cideb deletion in the liver protects against MASLD and ALD.
(A) Body weight, liver weight, and liver/body weight ratio of WT and whole-body KO mice fed with NC for 12 weeks. (B) Plasma ALT, AST, cholesterol, and triglycerides of mice from Fig. 4A. (C) H&E of livers from mice treated with NC, WC, CDA-HFD, and NIAAA. (D) Weights of WT and whole-body KO mice fed with WD for 12 weeks. (E) Plasma measurements of mice from Fig. 4D. (F) Weights of WT and whole-body KO mice fed with CDA-HFD for 12 weeks. (G) Plasma measurements of mice from Fig. 4F. (H) Weights of WT and whole-body KO mice fed with the NIAAA diet for 4 weeks with weekly oral gavage of 5 g/kg ethanol. (I) Plasma measurements of mice from Fig. 4H. (J) Weights of Cidebfl/fl mice injected with AAV-TBG-GFP or AAV-TBG-Cre, fed with WD for 24 weeks. (K) Plasma measurements of mice from Fig. 4J. (L) Weights of Cidebfl/fl mice injected with AAV-TBG-GFP or AAV-TBG-Cre, fed with CDA-HFD for 12 weeks. (M) Plasma measurements of mice from Fig. 4L. (N) Weights of Cidebfl/fl mice injected with AAV-TBG-GFP or AAV-TBG-Cre, fed with NIAAA diet for 4 weeks with weekly gavage of 5 g/kg ethanol. (O) Plasma measurements of mice from Fig. 4N. (P) H&E of livers from mice treated with WD, CDA-HFD, and NIAAA. (Q) Cholesterol and triglyceride content analysis from livers exposed to WD. (R) Cholesterol and triglyceride content analysis from livers exposed to CDA-HFD. (S) NAFLD activity score of the H&E sections from liver exposed to WD. The right panel represents the total NAFLD activity score, which is the sum of the four scores on the left (Each dot represents the average NAS score from 1–3 liver sections within a single slice). (T) NAFLD activity score of the H&E sections from liver exposed to CDA-HFD. The right panel represents the total NAFLD activity score, which is the sum of the four scores on the left (Each dot represents the average NAS score from 1–3 liver sections within a single slice). All mice in this figure were male, Data are shown as mean ± SEM. p-values were calculated by unpaired two-tailed Student’s t-test. *p < 0.05, **p < 0.01, ***p < 0.001, ****p < 0.0001.
Fig. 5
Fig. 5. Cideb deletion reverses MASLD progression in male and female mice.
(A) In the "Prevention" group, Cidebfl/fl mice were injected with AAV-TBG-GFP or AAV-TBG-Cre at 6 weeks of age and fed CDA-HFD for 12 weeks (data shown in Fig. 4L). In the "Treatment" group, Cidebfl/fl mice were fed CDA-HFD starting at 6 weeks of age for 6 weeks, then given AAV-TBG-GFP or AAV-TBG-Cre, then maintained on CDA-HFD for another 6 weeks before harvest. (B) Representative Sirius red staining of male “Prevention” group livers from Fig. 4L. (C) Body weight, liver weight, and liver/body weight ratio of male "Treatment" mice. (D) Plasma ALT, AST, and triglycerides from the male "Treatment" mice. (E) H&E staining of Cidebfl/fl livers from the 6 week timepoint (when the AAV was given), and from the control and KO male "Treatment" mice at the 12 week timepoint. (F) Sirius red staining of livers from the male "Treatment" mice. (G) Weights of female "Treatment" mice. (H) Plasma measurements from the female "Treatment" mice. (I) H&E staining of livers from the female "Treatment" mice. (J) Sirius red staining of livers from the female "Treatment" mice. Data are shown as mean ± SEM. p-values were calculated by unpaired two-tailed Student’s t-test. ***p < 0.001, ****p < 0.0001.
Fig. 6
Fig. 6. Influence of Cideb KO on DNL and VLDL lipidation/secretion.
(A) qPCR of DNL genes from livers fed with 24 weeks of WD. (B) qPCR of DNL genes from livers fed with 12 weeks of CDA-HFD. (C) Western blot of DNL-related proteins in livers exposed to WD for 24 weeks. (D) Western blot of DNL-related proteins in livers exposed to CDA-HFD for 12 weeks. (E) Total labeled fraction of liver fatty acid species after 5 hours of short-term 2H2O tracing in Cidebfl/fl and Alb-Cre; Cidebfl/fl mice. (F) VLDL-related mRNA expression from livers treated with 24 weeks of WD. Data taken from RNA-seq analysis. (G) VLDL-related mRNA expression from livers treated with 12 weeks of CDA-HFD. Data taken from RNA-seq analysis. (H) Poloxamer-407 assay on mice fed with WD for 1 week and fasted overnight. Plasma triglyceride levels were measured. (I) Poloxamer-407 assay on mice fed with CDA-HFD for 1 week and fasted overnight. Data are shown as mean ± SEM. p-values were calculated by unpaired two-tailed Student’s t-test. *p < 0.05, **p < 0.01, ***p < 0.001, ****p < 0.0001.
Fig. 7
Fig. 7. Cideb deletion increases FAO.
(A) qPCR of FAO genes from livers fed with 24 weeks of WD. (B) qPCR of peroxisome-related genes from livers fed with 24 weeks of WD. (C) qPCR of FAO genes from livers fed with 12 weeks of CDA-HFD. (D) qPCR of peroxisome-related genes from livers fed with 12 weeks of CDA-HFD. (E) Western blot analysis of FAO and peroxisome-related proteins in livers exposed to WD for 24 weeks. The CIDEB and ACTIN blots are the same as shown in Fig. 6C. (F) Western blot analysis of FAO- and peroxisome-related proteins in livers exposed to CDA-HFD for 12 weeks. The CIDEB and ACTIN blots are the same as shown in Fig. 6D. (G) Representative FAO blue (green) of primary hepatocytes treated with arachidic acid (20:0) or arachidonic acid (20:5) overnight from Cidebfl/fl and Alb-Cre; Cidebfl/fl mice. LDs were stained with LipidTOX (red) and nuclei were stained with Hoechst (blue) (scale bars = 5 µm). (H) Quantification of LD area from Fig. 7G. (I) Schematic of [U-13C]linolenic and [U-13C]stearic acid tracing. (J) Fractional enrichment of indicated liver isotopologues in Cidebfl/fl and Alb-Cre; Cidebfl/fl mice after 2-hour infusion with [U-13C]stearic acid (n=12, 12 mice). (K) Fractional enrichment of indicated liver isotopologues in Cidebfl/fl and Alb-Cre; Cidebfl/fl mice after 2-hour infusion with [U-13C]linolenic acid (n=12, 12 mice). (L) Plasma BHB from Cidebfl/fl mice injected with AAV-TBG-GFP or AAV-TBG-Cre fed with CDA-HFD for 1 month. (M) Relative FAO activity was assessed by measuring counts per minute (CPM) of 14CO2 production in primary hepatocytes isolated from Cidebfl/fl and Alb-Cre; Cidebfl/fl mice. The hepatocytes were treated with [1-14C]stearic acid or [1-14C]linolenic acid to evaluate the effect of Cideb deletion on fatty acid metabolism. Data are shown as mean ± SEM. p-values were calculated by unpaired two-tailed Student’s t-test. *p < 0.05, **p < 0.01, ***p < 0.001, ****p < 0.0001.
Fig. 8
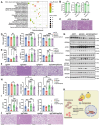
Fig. 8. Pparα and Atgl deletion rescue the protective effects of Cideb deletion
(A) Bubble plot showing differentially expressed pathways between WT and KO livers treated with 12 weeks of CDA-HFD. (B) Body weight, liver weight, and liver/body weight ratio of WT mice injected with AAV-TBG-GFP or AAV-TBG-PPARα-V5 and treated with CDA-HFD for 3 weeks. (C) Representative H&E staining of livers from Fig. 8B. (D) Body weight, liver weight, and liver/body weight ratio in male iCas9 mice given high-dose AAV-sgRNAs (sgCtrl, sgCideb, sgPparα, or sgCideb/sgPparα). At 8.5 weeks, mice were fed CDA-HFD for 3 weeks. (E) Liver function tests from mice in Fig. 8D. (F) Representative H&E staining of livers from Fig. 8D. (G) Western blot analysis of livers from Fig. 8D. (H) Body weight, liver weight, and liver/body weight ratio in male iCas9 mice given high-dose AAV-sgRNAs (sgCtrl, sgCideb, sgAtgl, or sgCideb/sgAtgl). At 8.5 weeks, mice were fed CDA-HFD for 3 weeks. (I) Liver function tests from mice in Fig. 8H. (J) Representative H&E staining of livers from Fig. 8H. (K) Model for how ATGL affects LDs, which subsequently influences PPARα function. Data are presented as mean ± SEM. Statistical analysis was performed using one-way ANOVA followed by Tukey’s post hoc test. *p < 0.05, **p < 0.01, ***p < 0.001, ****p < 0.0001.

References

    1. Ng SWK, Rouhani FJ, Brunner SF, et al. Convergent somatic mutations in metabolism genes in chronic liver disease. Nature. 2021;598:473–8. - PubMed
    1. Verweij N, Haas ME, Nielsen JB, et al. Germline Mutations in CIDEB and Protection against Liver Disease. N Engl J Med. 2022;387:332–44. - PubMed
    1. Li JZ, Ye J, Xue B, et al. Cideb regulates diet-induced obesity, liver steatosis, and insulin sensitivity by controlling lipogenesis and fatty acid oxidation. Diabetes. 2007;56:2523–32. - PubMed
    1. Xu W, Wu L, Yu M, et al. Differential Roles of Cell Death-inducing DNA Fragmentation Factor-α-like Effector (CIDE) Proteins in Promoting Lipid Droplet Fusion and Growth in Subpopulations of Hepatocytes. J Biol Chem. 2016;291:4282–93. doi: 10.1074/jbc.M115.701094. - DOI - PMC - PubMed
    1. Su L, Zhou L, Chen F-J, et al. Cideb controls sterol-regulated ER export of SREBP/SCAP by promoting cargo loading at ER exit sites. EMBO J. 2019;38 doi: 10.15252/embj.2018100156. - DOI - PMC - PubMed

LinkOut - more resources