. 2025 Jul 7;10(1):211.
doi: 10.1038/s41392-025-02296-7.

Acevaltrate as a novel ferroptosis inducer with dual targets of PCBP1/2 and GPX4 in colorectal cancer

Affiliations

Acevaltrate as a novel ferroptosis inducer with dual targets of PCBP1/2 and GPX4 in colorectal cancer

Dianping Yu et al. Signal Transduct Target Ther. .

Abstract

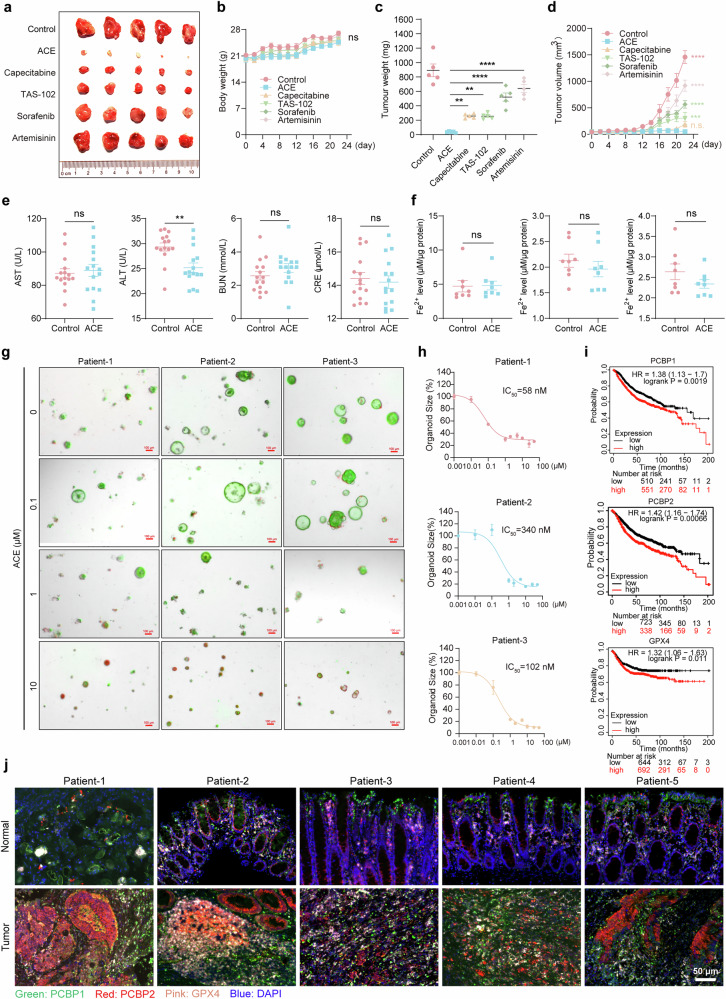
Ferroptosis induced by ferrous ions (Fe2+) and lipid peroxidation accumulation is a novel form of regulated cell death that has become a hot topic in tumor therapy research. Identifying small-molecule drugs that can induce ferroptosis in tumor cells is a very attractive therapeutic strategy. Here, we screened a natural product, acevaltrate (ACE), which rapidly and strongly induces ferroptosis in colorectal cancer cells. ACE not only increases Fe2+ levels in colorectal cancer cells by targeting iron chaperones PCBP1/2 and reducing their expression but also disrupts the antioxidant system of colorectal cancer cells by targeting GPX4 and inhibiting its enzymatic activity, leading to its ubiquitin-mediated degradation. This dual effect of ACE makes it significantly more effective than classical ferroptosis inducers in inducing ferroptosis. Our animal experiments revealed that the therapeutic effect of ACE surpasses that of established ferroptosis-inducing drugs and is superior to that of first-line clinical drugs such as capecitabine and TAS-102. Importantly, ACE also demonstrated superior inhibitory effects in colorectal tumor organoids versus at the cellular level, underscoring its potential for clinical application. This study pioneers the discovery of a small molecule inhibitor that targets both PCBP1/2 and GPX4, offering a novel therapeutic strategy for eliminating cancer cells through ferroptosis. Acevaltrate (ACE) was identified as a potent inducer of ferroptosis in colorectal cancer cells. ACE increases Fe2+ levels by targeting PCBP1/2 and disrupts the antioxidant system by inhibiting GPX4, leading to its degradation. This dual action makes ACE more effective at inducing ferroptosis than traditional inducers. Our study introduces ACE as the first small-molecule inhibitor of PCBP1/2 and GPX4, offering a new therapeutic approach for cancer cell elimination through ferroptosis.


Conflict of interest statement

Competing interests: The authors declare no competing interests.

Figures

None
Acevaltrate (ACE) was identified as a potent inducer of ferroptosis in colorectal cancer cells. ACE increases Fe2+ levels by targeting PCBP1/2 and disrupts the antioxidant system by inhibiting GPX4, leading to its degradation. This dual action makes ACE more effective at inducing ferroptosis than traditional inducers. Our study introduces ACE as the first small-molecule inhibitor of PCBP1/2 and GPX4, offering a new therapeutic approach for cancer cell elimination through ferroptosis
Fig. 1
Fig. 1
ACE inhibits cell migration and drug resistance. a Flow chart of the screening strategy. RKO cells were treated with a library of 420 natural compounds (10 μM) for 24 h. Cell viability was determined via a CCK-8 assay. The IC50 values of the candidates in different tumor cell lines were further examined. b Identification of antitumor compounds in the natural compound library for which the cell viability was lower than 20%. A change in color from blue to white represents a decrease in cell viability. c Structure of ACE. d IC50 values of ACE in different tumor cell lines. (n = 3, error bars represent SEM). e-h The inhibition ratio and IC50 of ACE (24 h) in HCT116 and RKO cells were measured via the CCK-8 assay. Inhibition ratios of NCM460 (f), SW620 (g), and HT29 (h) cells after ACE treatment for 24 h. (n = 3, error bars represent SEM). i Microscope images showing morphological changes in ACE-treated RKO and HCT116 cells. Scale bars, 200 μm. j, k RKO and HCT116 cells were incubated with ACE (0.1, 0.5, or 1 μM) in 12-well plates for 10 days, and the colony-forming potential of the tumor cells was assessed via crystal violet staining. (n = 3, error bars represent SEM, one-way ANOVA). l, m ACE (1, 2, or 5 μM) was incubated with RKO and HCT116 cells in 12-well plates for 24 h, and the proliferation of the tumor cells was detected via an EdU kit. (Scale bars, 200 μm. n = 3, error bars represent SEM, two-way ANOVA) n, o Cell cycle analysis and statistical analysis of RKO and HCT116 cells treated with ACE (1, 2, or 5 μM) for 24 h via flow cytometry. n = 3, data are shown as the mean ± SEM. The experiments consisted of three biological replicates with similar results. ****P < 0.0001
Fig. 2
Fig. 2
ACE induces ferroptosis in colorectal cancer cells. a, b Potential pathway analysis by KEGG enrichment in RKO (a) and HCT116 (b) cells and a heatmap showing differentially expressed proteins. Ferroptosis-related genes were labeled (fold change ≥1.2, unique peptides ≥2). c Volcano plot showing ferroptosis pathway gene expression in ACE-treated MCF7 cells (fold change ≥2, p value ≤ 0.05). d Heatmap showing oxidized polyunsaturated fatty acids after ACE (5 μM) treatment for 12 h. e AA and their metabolite levels in RKO cells treated with ACE (5 μM) for 12 h compared with DMSO. (n = 3, error bars represent SEM, Student’s t-test). f-i Viability of RKO and HCT116 cells treated with ferroptosis inhibitors (Fer-1: ferrostatin-1; Lip-1: liproxstatin-1; DFO: deferoxamine mesylate). (f) Z-VAD-FMK (g), NEC-1 (h), and CQ (i) after treatment with ACE (2 μM). The data are shown as the mean ± SEM. (n = 3, error bars represent SEM, one-way ANOVA). *P < 0.05, **P < 0.01, ***P < 0.001, ****P < 0.0001; ns not significant
Fig. 3
Fig. 3
ACE induces ferroptosis by inactivating GPX4 and accumulating Fe2+. a, b BODIPY-C11 staining (a) and flow cytometry (b) showing RKO cells treated with ACE (5 μM) with or without a ferroptosis inhibitor (Lip-1, DFO) or ferroptosis inducer (RSL3, erastin) for 2 h. (n = 3, scale bars, 1000 μm). c Liperfluo staining for analysis of lipid peroxidation in RKO and HCT116 cells after treatment with ACE (1, 2, or 5 μM) for 2 h. (n = 3, scale bars, 1000 μm). d Malondialdehyde (MDA) assay showing the lipid peroxidation levels of RKO cells treated with ACE. (n = 3, error bars represent SEM, one-way ANOVA). e Transmission electron microscopy images of RKO cells treated with ACE (5 μM, 12 h) and DMSO (12 h). 4200×: for the observation of intact individual cell morphology. 10500×: for the observation of clear mitochondrial morphology. Red arrowheads, mitochondrial atrophy with reduced cristae; black arrowheads, normal mitochondria. Seven cells per treatment condition were examined; scale bars, 5 μm. f Mitochondrial respiration was measured in ACE-treated (0.5 and 2 μM, 12 h) and DMSO-treated (Ctrl) RKO cells via a Seahorse XF96 system. The cells were treated with the indicated reagents (oligo: oligomycin, ATP synthase inhibitor). FCCP, mitochondrial oxidative phosphorylation uncoupler. Rot/AA: Rotenone and antimycin A, a mitochondrial respiratory chain inhibitor, were used to measure the basal oxygen consumption rate (OCR) and maximal respiration. (n = 3, error bars represent SEM, two-way ANOVA). g FerroOrange staining showing RKO cells treated with ACE (5 μM) with or without a ferroptosis inhibitor (Lip-1, DFO) or ferroptosis inducer (RSL3, erastin) for 24 h (n = 3, scale bars, 1000 μm). h Quantitative analysis of Fe2+ levels in RKO cells treated with ACE via a ferrous ion colorimetric assay. (n = 3, error bars represent SEM, one-way ANOVA). i HO-1 protein levels in RKO and HCT116 cells after dose-dependent ACE treatment. j DCFH-DA staining showing the intracellular ROS levels in RKO and HCT116 cells treated with ACE (1, 2, or 5 μM) for 2 h. (n = 3, scale bars, 200 μm). k RKO cells were treated with ACE (2, 5 μM) with or without the ROS scavenger NAC for 24 h, and cell viability was assayed via a CCK-8 assay. (n = 3, error bars represent SEM, one-way ANOVA). **P < 0.01, ***P < 0.001, ****P < 0.0001; ns not significant
Fig. 4
Fig. 4
ACE induces ferroptosis in vivo. a Bioluminescence images of HCT116-luc tumors taken every week. b, g Xenograft tumor images of HCT116-luc (b) and RKO (g) fully grown tumors versus residual tumors treated with ACE (10, 25, and 50 mg/kg). c, h Tumor weights of (b) and (g). (n = 5, error bars represent SEM, one-way ANOVA). d, i Mouse body weight. (n = 5, error bars represent SEM, two-way ANOVA). e, j Tumor volume curves showing mice treated orally with ACE (10, 25, or 50 mg/kg) and measured every 2 days. (n = 5, error bars represent SEM, two-way ANOVA). f, k Tumor volume curves for each mouse in different treatment groups corresponding to (e) and (j), respectively. l Immunohistochemistry (IHC) images of Ki-67, cleaved caspase 3 (Cl-Cas-3), PCBP1, PCBP2, and GPX4 in corn oil- or ACE-treated (10, 25, or 50 mg/kg) HCT116-luc mice. Scale bar, 200 μm. m Quantification of tumor MDA levels in RKO mice after ACE (10, 25, or 50 mg/kg) treatment for 22 days. (n = 3, error bars represent SEM, one-way ANOVA). n Quantification of tumor Fe2+ levels in the corn oil or ACE (50 mg/kg) groups. (n = 3, error bars represent SEM, two-tailed unpaired Student’s t test). **P < 0.01, ***P < 0.001, ****P < 0.0001; ns not significant
Fig. 5
Fig. 5
PCBP1/2 mediates ACE-induced Fe2+ accumulation and ferroptosis. a, b Western blot analysis of PCBP1 and PCBP2 protein levels in RKO and HCT116 cells after treatment with dose-dependent (a) or time-dependent (b) ACE. c Heatmap showing DARTS in the total protein of RKO cells treated with ACE for 1 h. Ferroptosis-related genes were labeled (fold change ≥1.2, unique peptides ≥2). d PCBP1/2 and Fe2+ levels in RKO cells were detected after ACE treatment for 24 h. The nuclei were stained with DAPI (blue), PCBP1/2 (green) was stained with a fluorescence-conjugated PCBP1/2 antibody, and Fe2+ was stained with FerroOrange (red) (n = 3 wells of a 12-well plate from one representative experiment; scale bars, 200 μm). e, f ROS levels (e) and Fe2+ levels (f) in PCBP1- or PCBP2-knockdown RKO and HCT116 cells were analyzed via flow cytometry. g Quantification of (f). (n = 3, error bars represent SEM, one-way ANOVA). h, i Flow cytometry analysis of Fe2+ levels in ACE-treated (1, 2, 5 μM, 24 h) PCBP1- or PCBP2-knockdown RKO cells, and the Fe2+ levels were quantified in (i). (n = 3, error bars represent SEM, one-way ANOVA). j Cell death analysis of PCBP1- or PCBP2-knockdown RKO and HCT116 cells via flow cytometry. k Western blot showing the overexpression efficiency of PCBP1 and PCBP2 in RKO cells, and the quantitative results are shown. (n = 3, error bars represent SEM, unpaired two-tailed Student’s t test). l, m Flow cytometry analysis of Fe2+ levels (l) and lipid ROS levels (m) in ACE-treated PCBP1- or PCBP2-overexpressing RKO cells. n Cell proliferation analysis of OE NC, OE PCBP1, and OE PCBP2 RKO cells (n = 3, SEM, two-way ANOVA). o Cell viability analysis showing the dose-dependent toxicity of ACE (0.5, 1, 2, 5, and 10 μM) in OE NC, OE PCBP1, and OE PCBP2 RKO cells via a CCK-8 assay. (n = 3, SEM, two-way ANOVA). *P < 0.05, **P<0.01,  ***P<0.001,  ****P < 0.0001; ns not significant
Fig. 6
Fig. 6
ACE directly binds to PCBP1/2. a, b CETSA showing the effect of ACE on the thermal stability of the PCBP1/2 protein in RKO cells. (n = 3, error bars represent SEM, two-way ANOVA). c Surface plasmon resonance (SPR) assay to determine the affinity between PCBP1 and ACE. d, e RKO cells were treated with ACE (2 or 5 μM) with or without the cysteine-rich thiol donor DTT for 24 h, after which cell viability (d) and protein levels (e) were detected. (n = 3, error bars represent SEM, one-way ANOVA). f, g Molecular modeling simulation of ACE docked on AlphaFold-predicted PCBP1 (f) (AF-Q15365-F1) and PCBP2 (g) (AF-Q15366-F1). h, i MST assay showing the binding of predicted binding site mutants, wild-type PCBP1 (h) or PCBP2 (i) to ACE. j Cell viability analysis showing the dose-dependent toxicity of ACE (0.5, 1, 2, 5, and 10 μM) in OE NC, OE PCBP1-C54A, and OE PCBP2-C54A RKO cells via a CCK-8 assay. (n = 3, error bars represent SEM, two-way ANOVA). ****P < 0.0001; ns not significant
Fig. 7
Fig. 7
ACE induces GPX4 depletion for ferroptosis. a, b Western blot analysis of GPX4 expression in RKO and HCT116 cells after treatment with dose-dependent (a) or time-dependent (b) ACE. c, d Measurement of GSH levels (c) and GPX enzyme activity (d) in RKO cells after treatment with ACE (1, 2, or 5 μM) for 24 h. (n = 3, error bars represent SEM, one-way ANOVA). e, f Flow cytometry analysis of cell death (e) and lipid peroxidation (f) in GPX4-knockdown or WT RKO cells. g Dose-dependent toxicity of ACE in RKO cells overexpressing GPX4, and CCK-8 assays were used to measure cell viability. (n = 3, error bars represent SEM). h Western blot analysis of RKO cells treated with ACE (2 or 5 μM) with or without DTT for 24 h. i Molecular docking of ACE to GPX4 (6nh3). GFP-tagged wild-type or U46 disruptive mutant GPX4 proteins were maintained at constant concentrations and fluorescence intensities, and ACE was diluted in a 1/2-fold gradient. The MST-on time of 1.5 s and dissociation constants Kd were determined. j Thermal stability analysis of GPX4 protein interactions with the indicated compounds from 43 °C to 61 °C. k, l CHX analysis of GPX4 abundance in RKO cells treated with or without ACE (5 μM) for different durations was performed by immunoblotting, and the GPX4 intensity was quantified in (l). (n = 3, error bars represent SEM, two-way ANOVA). m Immunoblotting was used to detect the degradation of GPX4 in RKO cells induced with lysosome (Baf) and proteasome (MG132) inhibitors. n IP assay showing the ubiquitin (Ub) modification of GPX4 in RKO cells treated with ACE (5 μM) for 1 h, after which MG132 was added and incubated for 3 h. o CCK-8 assay showing the dose-dependent toxicity of ACE in RKO cells transfected with si-NC or si-GPX4. p Flow cytometry analysis of Fe2+ levels in GPX4-knockdown RKO cells. *P < 0.05, ****P < 0.0001; ns not significant
Fig. 8
Fig. 8
Targeting PCBP1/2 as a potential strategy for tumor suppression. a-d Xenograft tumor images (a), tumor weights (b), body weights (c) and tumor volume curves (d) of RKO fully grown tumors versus residual tumors treated with ACE (50 mg/kg), capecitabine (500 mg/kg), TAS-102 (150 mg/kg), sorafenib (30 mg/kg), and artemisinin (50 mg/kg). (n = 5, error bars represent SEM, two-way ANOVA). e, f Quantitative analysis of ALT, AST, BUN, and CRE levels (e) and Fe2+ levels (f) in mice treated orally with ACE (50 mg/kg). g, h Calcein/PI staining (g) and organoid size (h) showing colorectal cancer organoids treated with ACE (0.01, 0.1, 1, 2, 5, 10, 25, or 50 μM) for 6 d. Scale bars, 100 μm. i Survival curves of CRC patients based on the expression of PCBP1, PCBP2, and GPX4. Scale bars, 50 μm. j The expression levels of PCBP1, PCBP2, and GPX4 in normal and tumor tissues of colorectal cancer patients were detected via triple-color fluorescence staining IHC. **P < 0.01, ****P < 0.0001; ns not significant

References

    1. Chen, X., Kang, R., Kroemer, G. & Tang, D. L. Broadening horizons: the role of ferroptosis in cancer. Nat. Rev. Clin. Oncol.18, 280–296 (2021). - PubMed
    1. Tang, D. L., Chen, X., Kang, R. & Kroemer, G. Ferroptosis: molecular mechanisms and health implications. Cell Res.31, 107–125 (2021). - PMC - PubMed
    1. Cheung, E. C. & Vousden, K. H. The role of ROS in tumour development and progression. Nat. Rev. Cancer22, 280–297 (2022). - PubMed
    1. Ai, Y. W., Meng, Y. T., Yan, B., Zhou, Q. Y. & Wang, X. D. The biochemical pathways of apoptotic, necroptotic, pyroptotic, and ferroptotic cell death. Mol. Cell84, 170–179 (2024). - PubMed
    1. Angeli, J. P. F., Krysko, D. V. & Conrad, M. Ferroptosis at the crossroads of cancer-acquired drug resistance and immune evasion. Nat. Rev. Cancer19, 405–414 (2019). - PubMed

MeSH terms

Substances