. 2025 Jul 7;6(1):48.
doi: 10.1186/s43556-025-00292-5.

Homeobox protein B6 and homeobox protein B8 control immune-cancer cell interactions in pancreatic cancer

Affiliations

Homeobox protein B6 and homeobox protein B8 control immune-cancer cell interactions in pancreatic cancer

Ludivine Bertonnier-Brouty et al. Mol Biomed. .

Abstract

Pancreatic ductal adenocarcinoma (PDAC) is a lethal cancer lacking effective drugs and therefore new treatment targets are needed. In this study, we define the role of homeobox protein B6 (HOXB6) and HOXB8 in controlling pancreatic cancer tumorigenesis and immune response. Transcriptomic analysis comparing human embryonic and PDAC tissue identified a large overlap of expression profiles suggesting a re-initiation of developmental programs in pancreatic cancer. Specifically, we identified the transcription factors HOXB6 and HOXB8 as potential regulators in PDAC. We described their functions in pancreatic cancer by performing transcriptomic and tumor tissue microarray analyses, in vitro assays in pancreatic and lung cancer cell lines and co-culture experiments with immune cells. Loss of HOXB6 and HOXB8 in pancreatic cancer cells inhibited cell proliferation, induced apoptosis and senescence and enhanced gemcitabine sensitivity. Moreover, reduced HOXB6 and HOXB8 expression in pancreatic and lung adenocarcinoma cell lines affected transcription of immune response pathways which resulted in an increased sensitivity of cancer cells to anti-tumorigenic activities of macrophages suggesting that the HOXB6 and HOXB8 immune regulatory function is conserved in different cancer types. Additionally, naïve M0 macrophages exposed to HOXB8 deficient PDAC cells were unable to differentiate into tumor-associated macrophages, suggesting that HOXB8 promotes the transition of initial anti-tumor macrophage to a tumor-promoting macrophage phenotype in pancreatic cancer. Our findings indicate that HOXB6 and HOXB8 play important roles in regulating cell proliferation, immune response, and treatment resistance to promote pancreatic cancer tumorigenesis and could be useful therapeutic targets.

Keywords: Fetal pancreas; Homeobox protein B6 (HOXB6); Homeobox protein B8 (HOXB8); Pancreatic cancer; Pancreatic ductal adenocarcinoma; Tumor-associated-macrophages.


Conflict of interest statement

Declarations. Ethics approval and consent to participate: Ethical permission has been obtained from the regional ethics committee in Lund (Dnr2012/593, Dnr 2015/241, Dnr 2018–579). The Surgical Ethics Committee of HUH approved the study protocol (Dnr. HUH 226/E6/06, extension TKM02 §66 17.4.2013). Informed consent was obtained from all subjects involved in the study. Consent for publication: Not applicable. Competing interests: All author declared no conflict of interest.

Figures

Fig. 1
Fig. 1
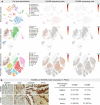
HOXB6 and HOXB8 are expressed in fetal and PDAC tissue. a Flow chart illustrating the workflow for identification of genes of interest. b Squares represent HOX genes organized by clusters. HOX genes upregulated in PDAC in Yan et al. [14] and Mao et al. [15] studies are indicated in red. c HOX genes upregulated in fetal pancreas in red. d HOX gene expression signatures in PDAC subtypes. Genes upregulated or downregulated are indicated in red or blue, respectively
Fig. 2
Fig. 2
HOXB6 and HOXB8 are expressed in embryonic mesenchyme and malignant ductal cells. a t-SNE embedding and HOX gene expression in pancreas from an 8-week PC embryo, in normal adult pancreas and PDAC tissues. Cells with HOXB6 or HOXB8 expression were colored according to their expression levels. b Representative images of HOXB6 and HOXB8 immunohistochemical staining and distribution of TMA-samples according to staining intensity (n = 154). Original magnification: 200x
Fig. 3
Fig. 3
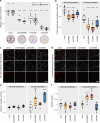
Colony formation, proliferation, cell viability, and apoptotic capacities are impaired in siHOXB6 and siHOXB8 transfected cells. a Relative colony formation quantification (n = 6). Results are shown as colony area or staining intensity percent 7 days post knock-down compared to negative control (scrambled RNA, siCtrl). b Quantification of EdU positive cells (n = 14). Results are shown as percent EdU positive cells of total cell number. Dapi and EdU staining 48 h (c) or 7 days (d) after transfection. Scale bars = 100 µm. Cells were exposed to EdU for 4 h. e Relative caspase activity 48 h or 7 days after transfection. Results are shown as caspase-3/7 activity compared to negative control (n = 6). f Cell viability 48 h and 7 days post transfection. Results are shown as viability/cytotoxicity ratio compared to negative control (n = 6). (a-b, ef) Tukey’s post-hoc test significances are indicated by stars compared to control when significant. * p < 0.05, ** p < 0.01 *** p < 0.001
Fig. 4
Fig. 4
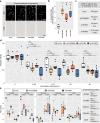
HOXB6 and HOXB8 regulate cell senescence and gemcitabine sensitivity. a Senescence-associated galactosidase activity for siHOXB6, siHOXB8, and siHOXB6B8 is shown in blue. Scale bar = 100 µm. b Quantification of senescent cells for all conditions as percent per total cell number (n = 10). c Quantification of the concentrations of gemcitabine required to reduce cell number by 50% (IC50) from the (d) Relative viability of 7-days transfected cells treated with varying concentrations of gemcitabine (n = 9). MTT assay quantifying the relative cell viability after 6 h-treatment with varying concentration of gemcitabine (µg/ml) to the dose 0 for each transfected cell condition. e Quantification of HOXB6, HOXB8, and ageing marker expression of 7-days transfected cells with or without 50 µg/ml of gemcitabine treatment (n = 4). 2-way ANOVA p.value results are indicated. KD: knock-down variable, GEM: gemcitabine treatment variable, KDxGEM: interaction effect between the knock-down and the gemcitabine treatment variables. Tukey’s post-hoc test significances are indicated by stars compared to the control when significant. ns p > 0.05, * p < 0.05, ** p < 0.01 *** p < 0.001
Fig. 5
Fig. 5
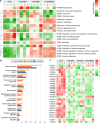
Transcription profiles and pathway analyses siHOXB6, siHOXB8, and siHOXB6B8 in PDAC. a Gene set enrichment analyses (n = 4). b Number of genes identified in Reactome enrichment pathways up-regulated in siHOXB6, siHOXB8, and siHOXB6B8. c Significantly altered HOX gene expression in siHOXB6, siHOXB8, and siHOXB6B8
Fig. 6
Fig. 6
Integrated chromatin occupancy and gene expression analysis of HOXB6 and HOXB8 in PANC-1 cells. a Strategy for integrating HOXB6 and HOXB8 ChIP-seq and RNA-seq data to identify common direct target genes and pathways. b HOXB6 target genes differentially regulated in siHOXB6, siHOXB8, and siHOXB6B8 RNAseq. c HOXB8 target genes differentially regulated in siHOXB6, siHOXB8, and siHOXB6B8 RNAseq. For each ChIP-seq and RNA-seq dataset interaction, the list of the Reactome pathways of the identified DEGs is shown
Fig. 7
Fig. 7
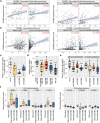
HOXB6 and HOXB8 modulate immune-cancer cell interactions. Correlation of HOXB6 and HOXB8 expression (log2 TPM) with the infiltration level of myeloid-derived suppressor cells (MDSC) and cancer associated fibroblasts estimated by TIMER [–38] in PDAC (a) and LUAD (b) (n = 179). Relative viability of PANC-1 cells (c, d) or Calu-3 cells (e) treated with macrophage conditioned medium (CM). MTT assays quantifying the relative cell viability of PANC-1 transfected cells (c, 7 days post transfection, n = 6) or Calu-3 transfected cells (e, 48 h (n = 20) or 7 days post transfection (n = 15)) after treatment with M0 CM compared to associated untreated transfected cells and (d) of PANC-1 cells exposed to conditioned media from siHOX-specific TAMs compared to PANC-1 cells exposed to siCtrl TAM CM (n = 15). f Quantification of the expression level of M1 and M2 surface markers from siHOX-specific TAMs (n = 4). Tukey’s post-hoc test significances are indicated by stars compared to the control when significant. * p < 0.05 ** p < 0.01 *** p < 0.001

Similar articles

References

    1. Kleeff J, Korc M, Apte M, La Vecchia C, Johnson CD, Biankin AV, et al. Pancreatic cancer. Nat Rev Dis Primers. 2016;2(1):1–22. 10.1038/nrdp.2016.22. - PubMed
    1. Qadir R, Umair MB, Tariq UB, Ahmad A, Kiran W, Shahid MH. Unraveling pancreatic cancer: epidemiology, risk factors, and global trends. Cureus. 2024;16(11):e72816. 10.7759/cureus.72816. - PMC - PubMed
    1. Stoffel EM, Brand RE, Goggins M. Pancreatic cancer: changing epidemiology and new approaches to risk assessment, early detection, and prevention. Gastroenterology. 2023;164(5):752–65. 10.1053/j.gastro.2023.02.012. - PMC - PubMed
    1. Hu JX, Lin YY, Zhao CF, Chen WB, Liu QC, Li QW, et al. Pancreatic cancer: A review of epidemiology, trend, and risk factors. World J Gastroenterol. 2021;27(27):4298. 10.3748/WJG.V27.I27.4298. - PMC - PubMed
    1. Quante AS, Ming C, Rottmann M, Engel J, Boeck S, Heinemann V, et al. Projections of cancer incidence and cancer-related deaths in Germany by 2020 and 2030. Cancer Med. 2016;5(9):2649–56. 10.1002/cam4.767. - PMC - PubMed

MeSH terms

LinkOut - more resources