. 2025 Sep;247(5):2245-2269.
doi: 10.1111/nph.70350. Epub 2025 Jul 7.

Functional study of Phaeodactylum tricornutum Seipin highlights specificities of lipid droplets biogenesis in diatoms

Affiliations

Functional study of Phaeodactylum tricornutum Seipin highlights specificities of lipid droplets biogenesis in diatoms

Damien Le Moigne et al. New Phytol. 2025 Sep.

Abstract

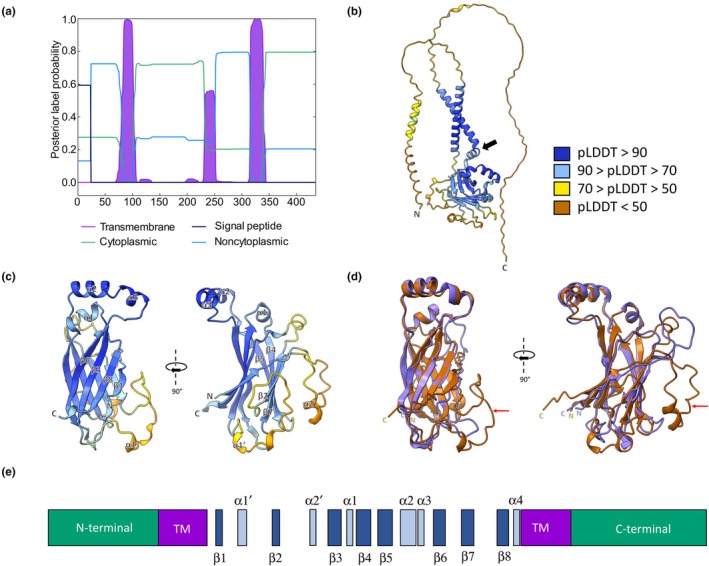
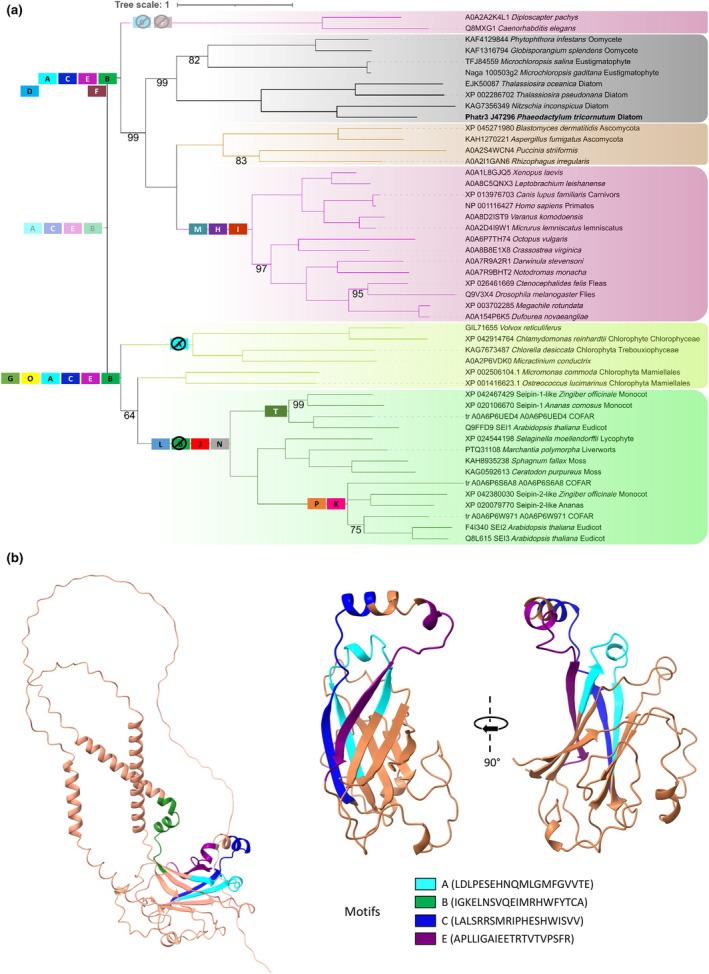
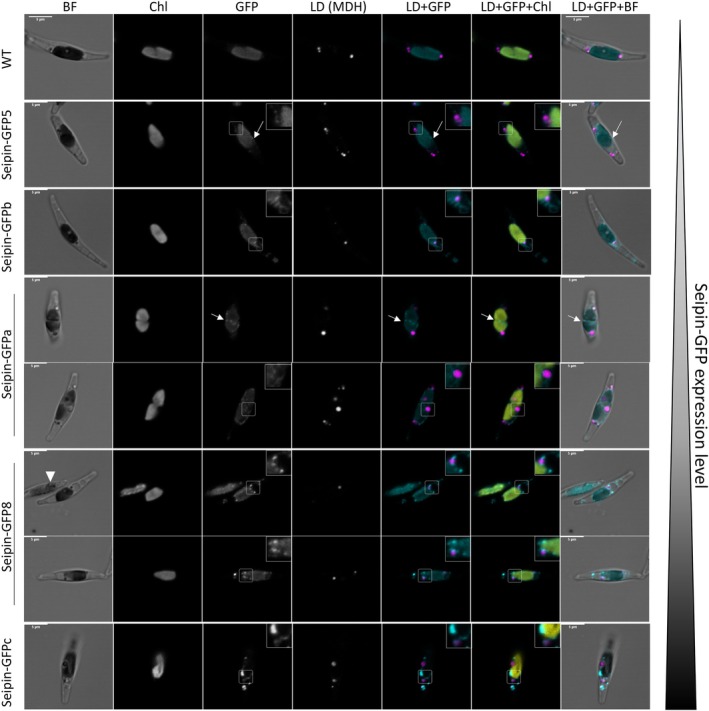
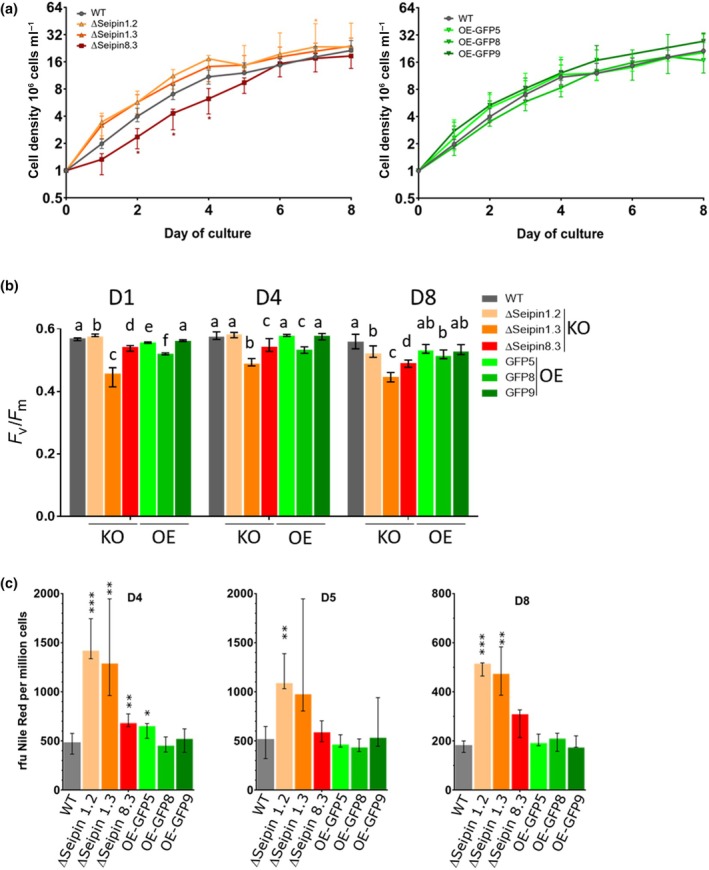
Diatoms are a major phylum of microalgae, playing crucial ecological roles. They derive from secondary endosymbiosis, leading to a complex intracellular architecture. Their ability to store oil in lipid droplets (LDs) upon unfavourable conditions has raised interest for applications, in particular biofuels, yet Lipid Droplet (LD) biogenesis mechanisms in these organisms remain poorly understood. Here, we functionally characterize the homolog of Seipin, a major actor of LD biogenesis, in Phaeodactylum tricornutum. We used an in silico approach to analyze the evolutionary origin of PtSeipin and its specific features. Then, we used a functional genetics approach with a combination of confocal and electronic microscopy and lipidomics to characterize the protein function. We provide evidence that Stramenopiles Seipins were inherited from the host during secondary endosymbiosis. The localization of PtSeipin highlights participation of the plastid's most external membrane in LD biogenesis. Finally, the knock-out (KO) of PtSeipin leads to a strong increase of triacylglycerol (TAG) accumulation, a feature that had not been observed in adipogenic or oleaginous cells and is greatly enhanced following high light exposure. Our results suggest a redirection of lipid fluxes toward TAG synthesis, reduced TAG recycling or a combination of both in PtSeipin KO.

Keywords: Phaeodactylum tricornutum; lipid droplets biogenesis; lipidomics; seipin; triacylglycerol (TAG).


Conflict of interest statement

None declared.

Figures

Fig. 1
Fig. 1
Phaeodactylum tricornutum Seipin (PtSeipin) in silico analysis. (a) Signal peptide and transmembrane domains prediction on PtSeipin complete sequence using Phobius (https://phobius.sbc.su.se/; Käll et al., 2007). Predicted transmembrane domains are represented in purple; green and light blue coloring of the bottom line indicate, respectively, that a domain is cytoplasmic or noncytoplasmic; signal peptide prediction is represented with a dark blue line. (b) PtSeipin structure prediction by AlphaFold (https://alphafold.ebi.ac.uk/entry/B7G3W8). The color code represent the per residue prediction model confidence (predicted local distance difference test (pLDDT)) according to (Jumper et al., 2021). Dark blue: very high confidence (pLDDT > 90); light blue: high confidence (90 > pLDDT > 70); yellow: low confidence (70 > pLDDT > 50); orange/brown: very low (pLDDT < 50). The black arrow highlights the presence of a ‘kinked helix’, also called ‘locking helix’, just before the C‐terminal transmembrane helix, an important conserved feature (Klug et al., ; Arlt et al., 2022). (c) Zoom on the luminal domain. The α‐helices (α1‐3) and β‐sheets (β1‐8) have been labelled to match labelling of published CryoEM Seipin structures from human and flies (Sui et al., ; Yan et al., 2018). Additional α‐helices that appear on the AlphaFold prediction have been labelled α1′ and α2′. α4 helix corresponds to the ‘kinked/locking helix’ (Klug et al., ; Arlt et al., 2022). (d) Superposition of PtSeipin predicted structure (brown) and human Seipin resolved CryoEM structure (purple). Red arrows highlight extra loops in PtSeipin structure. (e) General diagram of PtSeipin organization. The size and spacing of the different features respect their positions in PtSeipin sequence. This diagram highlights the position of the two loops containing the predicted α1′ and α2′ helices, respectively, between β1 and β2 and between β2 and β3. Green: N‐ and C‐terminal domains; purple: transmembrane domains (TM); dark blue: β‐sheets; light blue: α‐helices.
Fig. 2
Fig. 2
Phylogeny of Seipin proteins and ancestral motifs. (a) Midpoint rooted tree of Seipins. Sequence identification and phylogenetic analysis are described in the Materials and Methods section. Only posterior probabilities different from 100 are shown at the corresponding nodes. Sequences are colored according to the great groups to which they belong: archaeplastida (land plants and green algae, in green and yellow green, respectively), animals (in pink), fungi (in brown), and SAR (in grey). Diatom sequences are highlighted with larger lines, and Phaeodactylum tricornutum is in bold font. Presumed domains acquisition and loss based on the ancestral states analysis (Table S2) are shown in the picture. Domains A, C, E, and B that are common to both the SAR/Opistokonta and Archaeplastida are shown as probable in the common ancestor (shaded colors). Domains D and F are found both in the ancestor of SAR and in that of Opistokonta, but are not detected in nematode sequences, which appear to be very divergent and emerge at the base of the SAR/Opistokonta clade. As it is more parsimonious to suppose that they were present in the common ancestor and subsequently lost in nematodes, they were indicated at this position but placed below the other domains. (b) Positioning of the ancestral motifs A, B, C, and E on PtSeipin predicted structure (complete: left, zoom on the luminal domain: center and right). Structure prediction was retrieved from the AlphaFold Database and visualization was performed using ChimeraX. Motif A is shown in light blue, motif B in green, motif C in dark blue and motif E in purple.
Fig. 3
Fig. 3
Laser scanning confocal microscopy (LSCM) observation of the localization of PtSeipin in Phaeodactylum tricornutum in control culture conditions in exponential growth. Representative images of wild type (WT) and five lines overexpressing PtSeipin in fusion with the green fluorescent protein (PtSeipin‐green fluorescent protein (GFP) 5, 8, and a, b, c) cell lines. Cell lines are displayed from the lowest to the highest PtSeipin‐GFP expression levels (cf. Fig. S3b). Images for WT, PtSeipin‐GFP5 and b were acquired with the same acquisition parameters (laser power, gain). For PtSeipin‐GFPa, 8 and c, laser power and gain were decreased to avoid signal saturation. From left to right: pseudo‐brightfield (BF: greyscale); Chlorophyll autofluorescence (Chl: greyscale), PtSeipin‐GFP signal (GFP: greyscale), lipid droplets (LDs) stained with monodansylpentane (MDH: greyscale), overlay of Lipid Droplet (LD) and GFP signals (respectively, magenta and cyan), overlay of LD, GFP and Chl signals (respectively, magenta, cyan, and yellow), overlay of pseudo‐bright field with LD and GFP signals (respectively, grey, magenta, and cyan). Bars, 5 μm. Close‐ups on some LDs showing contacts with PtSeipin signal are shown. Dots at the surface of the plastid are highlighted in PtSeipin‐GFP5, where very few dots are visible, and PtSeipin‐GFPa, where they can be seen following plastid's division at the junction between the newly generated plastids (white arrows). One of the cells on the first PtSeipin‐GFP8 lines is dead (white arrowhead), leading to pigments leakage in the cytosol and increased autofluorescence in the GFP channel.
Fig. 4
Fig. 4
Cell physiology parameters in Phaeodactylum tricornutum Seipin (PtSeipin) mutants under control culture conditions. (a) Growth curves of wild‐type (WT: grey), PtSeipin Knock‐out (KO: orange and red, left panel) and PtSeipin fused to the green fluorescent protein (PtSeipin‐green fluorescent protein (GFP)) overexpressing lines (green, right panel). Cell concentrations (in million cells ml−1) were calculated based on absorbance at 730 nm, which was measured during 8 d. Median and interquartile range of six replicates are shown. Statistically significant differences between mutants and WT were evaluated by two‐way ANOVA with Dunett's multiple comparison test and are indicated as follows: *, P < 0.05. (b) Photosynthesis efficiency of WT (grey), PtSeipin KO (KO, orange and red) and PtSeipin‐GFP overexpressing lines (OE, green) was evaluated by measures of F v/F m at three points of the curve. Day 1: exponential phase; day 4: end of exponential phase; day 8: stationary phase. Median and interquartile range of six replicates are shown. Statistically significant differences between the different cell lines were evaluated using multiple t‐tests. Different letters indicate significant differences. (c) Neutral lipids accumulation during the stationary phase was evaluated by fluorescence intensity measures following Nile Red staining. WT is in grey, PtSeipin KO lines in orange and red and PtSeipin‐GFP overexpressing lines in green. Median and interquartile range of six replicates are shown. Statistically significant differences between mutants and WT were evaluated using multiple t‐tests and are indicated as follows: *, P < 0.05; **, P < 0.01; ***, P < 0.001.
Fig. 5
Fig. 5
Observation and quantification of lipid droplets (LDs) in Phaeodactylum tricornutum Seipin (PtSeipin) mutants after 4 d of culture in control (CT) culture conditions. (a) Representative laser scanning confocal microscopy (LSCM) images of wild‐type (WT), PtSeipin knock‐out lines (KO: ΔSeipin1.3, 8.1, and 8.3) and lines overexpressing PtSeipin in fusion with the green fluorescent protein (OE‐GFP5, 8 and 9) after staining with Nile Red. From left to right: pseudo‐bright field (BF: grey), Nile Red fluorescence (greyscale) and overlay of pseudo‐bright field with Nile Red and Chl signals (respectively, grey, cyan, and magenta). Bars, 5 μm. (b) Quantification of the number of LDs per cell in all the cell lines: WT (grey), PtSeipin KO (orange and red) and PtSeipin‐green fluorescent protein (GFP) overexpressing lines (green). Results are presented as boxplots and each dot corresponds to an individual cell. The median is indicated with a line and the mean with a ‘+’. WT: n = 13, Δseipin1.3: n = 9, Δseipin8.1: n = 7, Δseipin8.3: n = 14, OE‐GFP5: n = 13, OE‐GFP8: n = 15, and OE‐GFP9: n = 8. Statistically significant differences between mutants and WT were evaluated using multiple t‐tests but none were found. (c) Quantification of the size of Lipid Droplet (LD) in all the cell lines: WT (grey), PtSeipin KO (orange and red) and PtSeipin‐GFP overexpressing lines (green). Results are presented as boxplots, and each dot corresponds to an individual LD. The median is indicated with a line. WT: n = 43, Δseipin1.3: n = 24, Δseipin8.1: n = 22, Δseipin8.3: n = 30, OE‐GFP5: n = 61, OE‐GFP8: n = 72, and OE‐GFP9: n = 28. Statistically significant differences between mutants and WT were evaluated using multiple t‐tests and are indicated as follows: *, P < 0.05; **, P < 0.01; ***, P < 0.001.
Fig. 6
Fig. 6
Observation and quantification of lipid droplets (LDs) in Phaeodactylum tricornutum Seipin (PtSeipin) mutants after 4 d of culture in high light (HL) culture conditions. (a) Representative laser scanning confocal microscopy (LSCM) images of wild‐type (WT), PtSeipin knock‐out lines (KO: ΔSeipin1.3, 8.1, and 8.3) and lines overexpressing PtSeipin in fusion with the green fluorescent protein (OE‐GFP5, 8, and 9) after staining with Nile Red. From left to right: pseudo‐bright field (BF: grey), Nile Red fluorescence (greyscale) and overlay of pseudo‐bright field with Nile Red and Chlorophyll signals (respectively, grey, cyan, and magenta). Bars, 5 μm. (b) Quantification of the number of LDs per cell in all the cell lines: WT (grey), PtSeipin KO (orange and red), and PtSeipin‐green fluorescent protein (GFP) overexpressing lines (green). Results are presented as boxplots and each dot corresponds to an individual cell. The median is indicated with a line and the mean with a ‘+’. WT: n = 6, Δseipin1.3: n = 8, Δseipin8.1: n = 7, Δseipin8.3: n = 11, OE‐GFP5: n = 4, OE‐GFP8: n = 10, and OE‐GFP9: n = 5. Statistically significant differences between mutants and WT were evaluated using multiple t‐tests and are indicated as follows: *, P < 0.05; **, P < 0.01; ***, P < 0.001. (c) Quantification of the size of Lipid Droplet (LD) in all the cell lines: WT (grey), PtSeipin KO (orange and red) and PtSeipin‐GFP overexpressing lines (green). Results are presented as boxplots, and each dot corresponds to an individual LD. The median is indicated with a line. WT: n = 29, Δseipin1.3: n = 11, Δseipin8.1: n = 12, Δseipin8.3: n = 21, OE‐GFP5: n = 29, OE‐GFP8: n = 37, and OE‐GFP9: n = 20. Statistically significant differences between mutants and WT were evaluated using multiple t‐tests and are indicated as follows: **, P < 0.01; ***, P < 0.001.
Fig. 7
Fig. 7
Transmission electron microscopy observation of cryo‐fixed wild‐type and Phaeodactylum tricornutum Seipin (PtSeipin) knock‐out after 4 d of culture in high light culture conditions. m, mitochondrion; N, nucleus; P, plastid; *, lipid droplets.
Fig. 8
Fig. 8
Segmentation of wild‐type (WT) and Phaeodactylum tricornutum Seipin (PtSeipin) knock‐out (KO) following focused ion beam‐scanning electron microscopy (FIB‐SEM) and volumes of the different organelles. (a) Segmentation of a WT (left) and a PtSeipin KO (ΔPtSeipin1.3, right) cells. Upper panel shows the segmentation of the total volume while the two lower panels show two 3D views of the segmentation of the different organelles. Yellow: lipid droplet (LD); magenta: mitochondria; blue: nucleus; green: plastid. (b) Measures of the volumes occupied by the total cell and the different organelle compartments within the cell. For all organelles, the raw volume (in μm3) and the relative occupancy of the cell as a percentage of the cell volume (%V) are shown. For the pyrenoid, the % of the plastid volume occupied (%VPlastid) is also shown. WT are shown as grey circles and ΔPtSeipin1.3 as orange squares. For each cell line, the two values corresponding to the two segmented cells are shown. (c) Measures of the Lipid Droplet (LD) numbers and distribution of LD volumes (in μm3) in WT and PtSeipin KO cells. Upper graph: each dot represents the number of LD within one cell; lower graph: each dot represents a LD.
Fig. 9
Fig. 9
Glycerolipid and triacylglycerols (TAG) profiles of wild‐type (WT) and Phaeodactylum tricornutum Seipin (PtSeipin) mutants. (a) Glycerolipids profiles after 4 d (D4, upper panel) and 8 d (D8, lower panel) of culture in control condition (CT: 75 μmol photons m−2 s−1). (b) Glycerolipids profiles after 4 d (D4, upper panel) and 8 d (D8, lower panel) of culture in high light (HL: 200 μmol photons m−2 s−1). (c) TAG profiles after 4 d (D4, upper panel) and 8 d (D8, lower panel) of culture in control condition (CT: 75 μmol photons m−2 s−1). (d) TAG profiles after 4 d (D4, upper panel) and 8 d (D8, lower panel) of culture in high light (HL: 200 μmol photons m−2 s−1). Glycerolipid classes and TAG species were quantified following liquid chromatography and tandem mass spectrometry (LC‐MS/MS) as described in the Materials and Methods section. Glycerolipid classes are presented in adjusted nmol/mg of dry weight, while TAG species are presented in mol%. Median, min and max values of biological triplicates are shown. PtSeipin knock‐out (KO) lines are SeipinΔ1.2, Δ1.3, Δ8.1, and Δ8.3. Lines overexpressing PtSeipin in fusion with the green fluorescent protein are OE‐GFP5, 8, and 9. SQDG, sulfoquinovosyl‐diacylglycerol; MGDG, monogalactosyl‐diacylglycerol; DGDG, digalactosyl‐diacylglycerol; PG, phosphatidylglycerol; PI, phosphatidylinositol, PE, phosphatidylethanolamine, PC, phosphatidylcholine, DGTA, 1(3),2‐diacylglyceryl‐3(1)‐O‐2′‐(hydroxymethyl)(N,N,N,‐trimethyl)‐β‐alanine; DAG, diacylglycerol; TAG, triacylglycerol. Statistically significant differences between mutants and WT were evaluated using multiple t‐tests and are indicated as follows: *, P < 0.05; **, P < 0.01; ***, P < 0.001.

Similar articles

Cited by

References

    1. Abida H, Dolch L‐J, Meï C, Villanova V, Conte M, Block MA, Finazzi G, Bastien O, Tirichine L, Bowler C et al. 2015. Membrane glycerolipid remodeling triggered by nitrogen and phosphorus starvation in Phaeodactylum tricornutum1. Plant Physiology 167: 118–136. - PMC - PubMed
    1. Allorent G, Guglielmino E, Giustini C, Courtois F. 2018. Generation of mutants of nuclear‐encoded plastid proteins using CRISPR/Cas9 in the diatom Phaeodactylum tricornutum . In: Maréchal E, ed. Plastids: methods and protocols. New York, NY, USA: Springer US, 367–378. doi: 10.1007/978-1-4939-8654-5_24. - DOI - PubMed
    1. Altschul SF, Madden TL, Schäffer AA, Zhang J, Zhang Z, Miller W, Lipman DJ. 1997. Gapped BLAST and PSI‐BLAST: a new generation of protein database search programs. Nucleic Acids Research 25: 3389–3402. - PMC - PubMed
    1. Altschul SF, Wootton JC, Gertz EM, Agarwala R, Morgulis A, Schäffer AA, Yu Y‐K. 2005. Protein database searches using compositionally adjusted substitution matrices. The FEBS Journal 272: 5101–5109. - PMC - PubMed
    1. Amari C, Carletti M, Yan S, Michaud M, Salvaing J. 2024. Lipid droplets degradation mechanisms from microalgae to mammals, a comparative overview. Biochimie 227(Pt B): 19–34. - PubMed

LinkOut - more resources