. 2025 Jul;14(7):e70118.
doi: 10.1002/jev2.70118.

Induced Treg-Derived Extracellular Vesicles Suppress CD4+ T-Cell-Mediated Inflammation and Ameliorate Bone Loss During Periodontitis Partly Through CD73/Adenosine-Dependent Immunomodulatory Mechanisms

Affiliations

Induced Treg-Derived Extracellular Vesicles Suppress CD4+ T-Cell-Mediated Inflammation and Ameliorate Bone Loss During Periodontitis Partly Through CD73/Adenosine-Dependent Immunomodulatory Mechanisms

Carolina Rojas et al. J Extracell Vesicles. 2025 Jul.

Abstract

Regulatory T cell (Treg)-derived extracellular vesicles (EVs) represent a contact-independent mechanism by which Tregs suppress dysregulated immune responses. These EVs carry diverse immunomodulatory molecules, including CD73, an ectoenzyme that hydrolyses AMP into adenosine. Adenosine subsequently acts as a potent immunosuppressive mediator that inhibits effector CD4⁺ T cell activation and controls pathological inflammation. Periodontitis is a highly prevalent inflammatory disease characterised by the accumulation of IL-17A-expressing CD4⁺ T cells in response to dysbiotic oral bacterial biofilms, ultimately leading to RANKL-mediated alveolar bone resorption and tooth loss. We tested the hypothesis that CD73⁺ Treg-derived EVs, isolated from Tregs induced with polarising cytokines in the presence of retinoic acid, could limit inflammation and prevent alveolar bone loss in periodontitis. Our findings demonstrate that Tregs induced with polarising cytokines in the presence of retinoic acid express high levels of CD73 and secrete adenosine-producing suppressive CD73+ EVs. Furthermore, local administration of these CD73⁺ Treg-derived EVs in a murine periodontitis model reduced activated CD4⁺ T cell infiltration, decreased IL-17A and RANKL expression, and attenuated osteoclast-mediated alveolar bone loss. In conclusion, retinoic acid-induced Treg-derived EVs suppress CD4⁺ T cell-driven inflammation and ameliorate periodontitis, at least in part through CD73/adenosine-dependent immunomodulatory mechanisms.

Keywords: 5’‐nucleotidase; Treg; adenosine; extracellular vesicles; periodontitis; regulatory T cell; retinoic acid.


Conflict of interest statement

The authors declare no conflicts of interest.

Figures
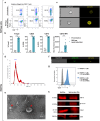
FIGURE 1
FIGURE 1
Tregs induced in the presence of retinoic acid (RATregs) highly upregulate CD73 and secrete CD73+ EVs (RATEVs). CD4+ T cells were magnetically isolated, activated in plate‐bound with anti‐CD3ε and anti‐CD28 (10 and 1 µg/mL, respectively), and exposed to IL‐2 (100 IU/mL), TGF‐β1 (10 ng/mL) and retinoic acid (100 nM) to be differentiated into RATregs. From them, RATEVs were obtained by ultracentrifugation. (a) Representative dot plots showing the Foxp3, CD25 and CD73 expression in non‐induced CD4+ T‐cells (upper panel) and RATregs (lower panel) assessed by flow cytometry. (b) The graphs show the quantitative analysis of CD73, Foxp3 and CD25 expression in non‐induced CD4+ T cells and RATregs induced by polarising cytokines and retinoic acid. (c) RATreg CD73 expression and cellular localisation analysis by imaging flow cytometry. (d) Characterisation of RATEVs size and relative concentration by nanoparticle tracking analysis (NTA). (e) Size and morphology of RATEVs by transmission electron microscopy (TEM). (f) RATEVs CD73 expression assessment by imaging flow cytometry. (g) RATEV CD73 expression assessment by latex beads‐assisted flow cytometry. The blue histogram represents bead‐bound RATEVs incubated with anti‐CD73 and anti‐mouse Alexa Fluor 488 antibodies. Beads‐bounded RATEVs (light grey histogram) and beads‐bounded RATEVs incubated only with the secondary antibody (dark grey histogram) were used as controls. (h) Immunoblot analysis for CD73, β‐actin, CD81 and CD9 in RATEVs and EVs obtained from erythrocyte‐depleted splenocytes. ****p < 0.001.
FIGURE 2
FIGURE 2
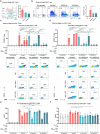
In RATregs and RATEVs, CD73 exerts AMPase activity and catalyses ADO and phosphate production. The CD73‐mediated AMPase activity in RATregs and RATEVs was evaluated by assessing inorganic phosphate and adenosine (ADO) production. (a) 2.5, 5, or 10 × 104 RATregs or (b) RATEVs obtained from 1 or 2 × 106 RATregs were resuspended in phosphate‐free buffer and incubated alone or in the presence of 5’‐AMP. In some conditions, the CD73‐specific inhibitor termed 5’‐(α,β‐methylene) diphosphate ADP analogue (ADPan) was added. To quantify phosphate levels, values were compared to a standard curve. Data represent the amount of inorganic phosphate produced over background (RATregs or RATEVs incubated in the absence of 5’‐AMP) and are shown as mean±SD of five samples pooled from five independent experiments. Supernatant ADO levels produced by (c) 1 or 2 × 105 RATregs and (d) RATEVs obtained from 2 × 106 RATregs were measured in samples incubated alone or in the presence of 5’‐AMP. In some conditions, ADPan (CD73 inhibitor) was added. Control conditions included culture medium alone, medium with AMP, or AMP and CD73 inhibitor (data not shown). To quantify the ADO levels, values were compared to a standard curve. ***p < 0.001.
FIGURE 3
FIGURE 3
CD73‐mediated AMPase activity support RATEV immunosuppressive capacity over CD4+ T cells. Erythrocyte‐ depleted splenocytes derived T cells labelled with Cell Trace Violet (CTV) were activated in vitro with soluble anti‐CD3ε (1 µg/mL) and treated with RATEVs (1 and 2.5 × 108 particles, termed RATEVs‐lo and RATEVs‐hi, respectively) for 72 h. Non‐activated (NA) or activated (Act) untreated cells (exposed to the vehicle) were defined as negative and positive activation controls, respectively. (a) Representative histograms that show CD4+ T cell proliferation (CTV dilution) in the following conditions: Non‐activated (grey line), untreated activated (red line) and RATEV‐treated activated (light and dark blue lines) cells. Each histogram peak represents a proliferation cycle in which parent cells are divided. The graph shows the proliferation index values as mean±SD. (b) Representative dot plots and graphs of the mean percentage for activated (CD25+) CD4+ T cells. (c) CD4+CD73 or (d) CD4+CD73+ responder T cells obtained from C57BL/6 Foxp3GFP+ transgenic mice and isolated by cell sorting were activated with anti‐CD3ε (5 µg/mL) and anti‐CD28 (2 µg/mL) antibodies, in the presence of EHNA (10 µM) and NBTI (10 µM) inhibitors, and incubated with or without 5’‐AMP (50 µM), RATEVs (1 or 2.5 × 108 particles, termed RATEVs‐lo and RATEVs‐hi, respectively), and/or ADPan or APCP CD73 inhibitors (100 µM). T‐cell activation was evaluated by quantifying the CD25 expression using flow cytometry. Immediately below the charts, representative smoothed dot plots are shown for each condition. The assay was performed in duplicate for each condition, and graphs show data presented as CD25+ T cells mean±SD percentage. In (e) CD4+CD73 and (f) CD4+CD73+ responder T cells, activated and treated following the protocol described for (c) and (d), the IL‐17A production was analysed. Data are presented as mean±SD pg/mL. *p < 0.05, **p < 0.01, ***p < 0.001. ns = non‐significant.
FIGURE 4
FIGURE 4
RATEVs suppress CD4+ T‐cell immune responses in periodontitis‐affected periodontal tissues. (a) Schematic representation of the experimental design showing the periodontitis induction model and RATEVs inoculation scheme. Animals were treated with RATEVs at two concentrations (1 and 2.5 × 108 particles, termed RATEVs‐lo and RATEVs‐hi, respectively). At Day 10, periodontal tissue samples were isolated and processed for flow cytometry analysis. (b) Graph showing the frequency of CD4+CD25+ T cells. (c) Representative dot plots and graphs showing the frequency of CD4+IL‐17A+ T cells. (d) Representative dot plots and graphs showing the frequency of CD4+RANKL+ T cells. (e) Graph showing the frequency of total CD4+Foxp3+ Tregs. (f) Graph showing the frequency of CD4+Foxp3+IL‐17A+ Tregs. (g) Graph showing the frequency of CD4+CD73+ T cells. (h) CD73 MFI on CD4+ T cells. Data are expressed as mean±SD. *p < 0.05, **p < 0.01.
FIGURE 5
FIGURE 5
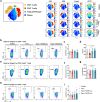
RATEVs upregulate CD73 expression in T cells infiltrating cervical lymph nodes that drain periodontitis‐affected periodontal tissues. (a) Schematic viSNE map (left figure) showing the topographical location of cell populations in which CD73 expression was assessed. Subpopulations are represented using colour‐coding (CD4+ T cells, CD8+ T cells, Tregs and other immune cells). Representative maps from the viSNE analysis of 1 × 104 cells, where the different lineage expression (CD4 and CD8 T cells) and phenotypic markers Foxp3 and CD73 were analysed and expressed in a heat map‐like colour scale (right panel). The viSNE maps show in red the spatial location of three cell populations: CD4+ T cells (first column), CD8+ T cells (second column) and CD4+Foxp3+ Tregs (third column). CD73 expression levels in the aforementioned cells are shown in the fourth column. (b) Representative dot plots showing the frequency of CD4+CD73+ T cells assessed by flow cytometry. (c) Graph showing the frequency of CD4+CD73+ T cells. (d) Graph showing CD73 expression in CD4+ T cells measured as MFI. (e) Representative dot plots showing the frequency of CD4+Foxp3+CD73+ Tregs. (f) Graph showing the frequency of CD4+Foxp3+CD73+ Tregs. (g) Graph showing CD73 expression in CD4+Foxp3+ Tregs measured as MFI. (h) Representative dot plots showing the frequency of CD8+CD73+ T cells. (i) Graph showing the frequency of CD8+CD73+ T cells. Data are expressed as mean±SD. *p < 0.05, **p < 0.01. ns = non‐significant.
FIGURE 6
FIGURE 6
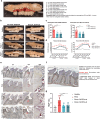
RATEVs ameliorate bone resorption during periodontitis. (a) Illustrative figure showing how measurements for the distance between the cement‐enamel junction (CEJ) and alveolar bone crest (ABC) were performed to analyse tooth‐supporting bone loss. The lines correspond to the CEJ‐ABC distance measured in the three maxillary molars. (b) Representative maxillary alveolar bone photographs for each experimental condition. The dotted black line corresponds to the area delimited by the CEJ, ABC, mesial surface of the first molar and distal surface of the third molar. (c) Bone resorption area quantification was evaluated on the palatal (left) and buccal (right) surfaces. Data are expressed as the change in the bone area after subtracting the mean area value obtained from the unligated healthy controls used as a reference. (d) CEJ‐ABC linear distance quantification evaluated in the nine anatomic sites of the maxilla palatal, and buccal surfaces. (e) Representative images of TRAP+ osteoclast (OCs) detection in histologic samples for each condition. Acquired at 4× (left column), 10× (middle column) and 100× (right column) magnification. The red dashed line box delimits the area selected for the 100× magnification, and the red arrowheads show TRAP+ osteoclasts in direct contact with alveolar bone. (f) Schematic representation that illustrates the teeth and alveolar bone anatomy for OCs detection. (g) Number of TRAP+ osteoclasts detected for each experimental condition. **p < 0.01, ***p < 0.001, ****p < 0.0001.
FIGURE 7
FIGURE 7
Graphical summary. (a) RATregs express high levels of CD73 and (b) secrete CD73+ RATEVs capable of hydrolysing exogenous AMP into the immunosuppressive ADO. (c) RATEVs suppressed CD4+ effector T cells in a CD73/AMP/ADO‐dependent manner. (d) The local administration of RATEVs into periodontitis lesions controlled the inflammatory and osteolytic response by suppressing activated (CD25+), IL‐17A‐producing and RANKL‐expressing CD4+ T cells. (e) RATEV treatment decreased the number of bone‐resorbing osteoclasts and ameliorated alveolar bone resorption. ADO = adenosine, AMP = adenosine monophosphate, ARs = adenosine receptors, CD25 = alpha‐chain from the interleukin‐2 receptor, CD73 = 5’‐ectonucleotidase, OBs = osteoblasts, OCs = osteoclasts, Pi = inorganic phosphate, RANK = receptor activator of nuclear factor κB, RANKL= RANK ligand, RATEVs = RATreg‐derived extracellular vesicles, RATregs = Retinoic acid‐induced Tregs, Teff = effector T cells, Tregs = regulatory T cells (Foxp3+ cells).

References

    1. Allard, B. , Turcotte M., and Stagg J.. 2012. “CD73‐Generated Adenosine: Orchestrating the Tumor‐Stroma Interplay to Promote Cancer Growth.” Journal of Biomedicine and Biotechnology 2012: 485156. 10.1155/2012/485156. - DOI - PMC - PubMed
    1. Alvarez, C. , Abdalla H., Sulliman S., et al. 2021. “RvE1 Impacts the Gingival Inflammatory Infiltrate by Inhibiting the T Cell Response in Experimental Periodontitis.” Frontiers in Immunology 12: 664756. 10.3389/fimmu.2021.664756. - DOI - PMC - PubMed
    1. Alvarez, C. , Monasterio G., Cavalla F., et al. 2019. “Osteoimmunology of Oral and Maxillofacial Diseases: Translational Applications Based on Biological Mechanisms.” Frontiers in Immunology 10: 1664. 10.3389/fimmu.2019.01664. - DOI - PMC - PubMed
    1. Alvarez, C. , Suliman S., Almarhoumi R., et al. 2020. “Regulatory T Cell Phenotype and Anti‐Osteoclastogenic Function in Experimental Periodontitis.” Scientific Reports 10, no. 1: 19018. 10.1038/s41598-020-76038-w. - DOI - PMC - PubMed
    1. Amir el, A. D. , Davis K. L., Tadmor M. D., et al. 2013. “viSNE Enables Visualization of High Dimensional Single‐Cell Data and Reveals Phenotypic Heterogeneity of Leukemia.” Nature Biotechnology 31, no. 6: 545–552. 10.1038/nbt.2594. - DOI - PMC - PubMed

MeSH terms

LinkOut - more resources