. 2025 Jul;14(13):e71012.
doi: 10.1002/cam4.71012.

Mendelian Randomization Analysis of Mitochondria-Related Genes and Screening of Prognostic Genes in Colorectal Cancer

Affiliations

Mendelian Randomization Analysis of Mitochondria-Related Genes and Screening of Prognostic Genes in Colorectal Cancer

Limin Zhu et al. Cancer Med. 2025 Jul.

Abstract

Background: Mitochondria have been linked with inflammatory colorectal cancer (CRC) development; however, the association between mitochondria-related genes (MRGs) and CRC remains unknown.

Aims: To explore the causal relationship between MRGs and CRC, screen prognostic genes, conduct drug prediction analyses, and investigate the correlations between prognostic genes and immune cells.

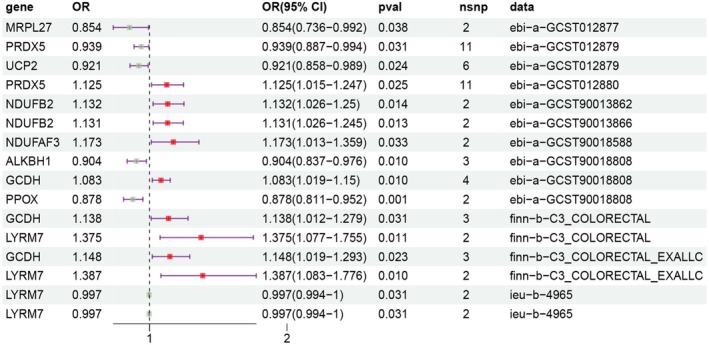
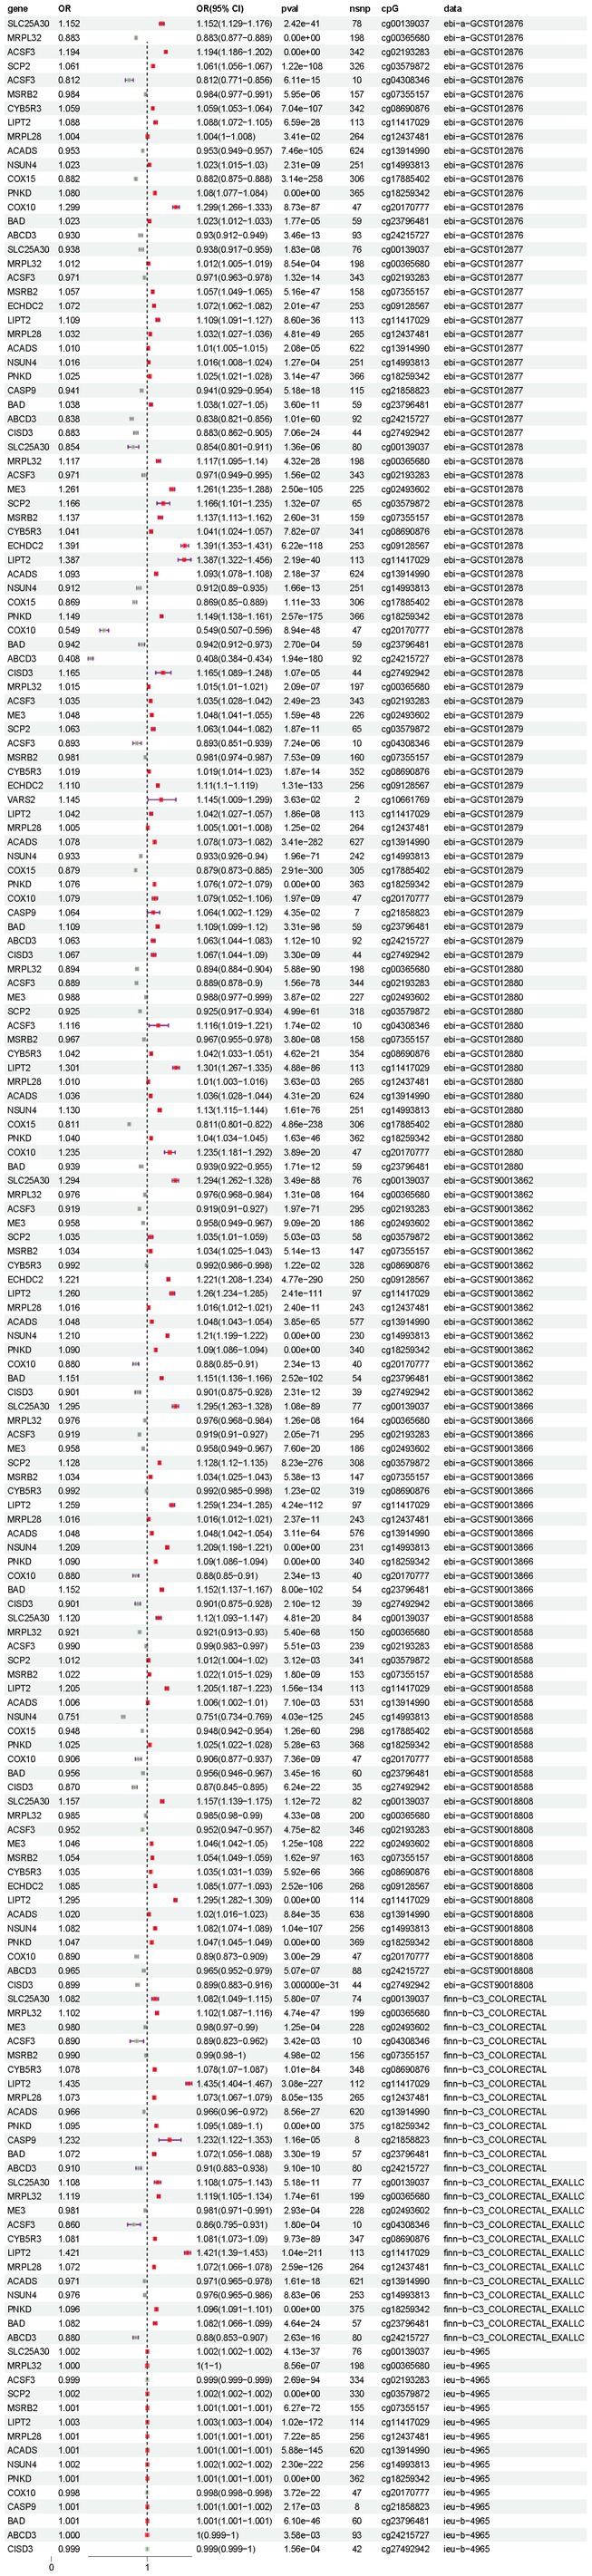
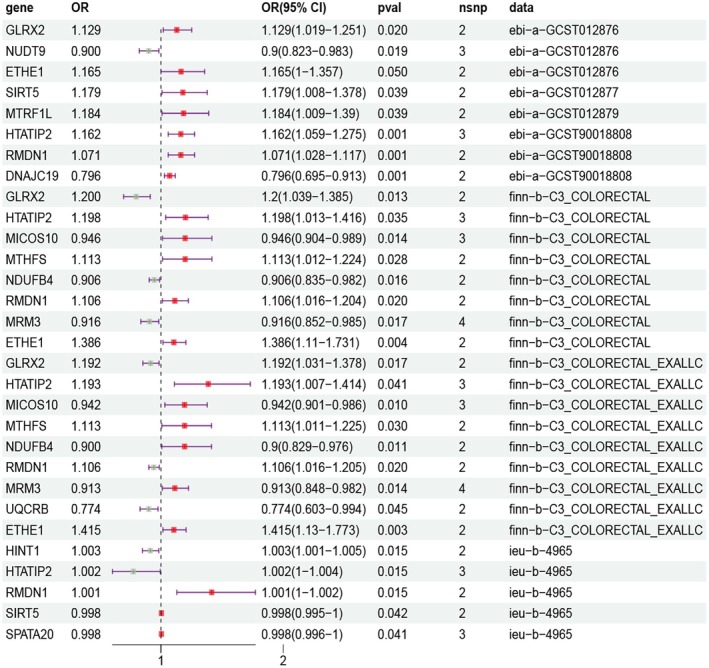
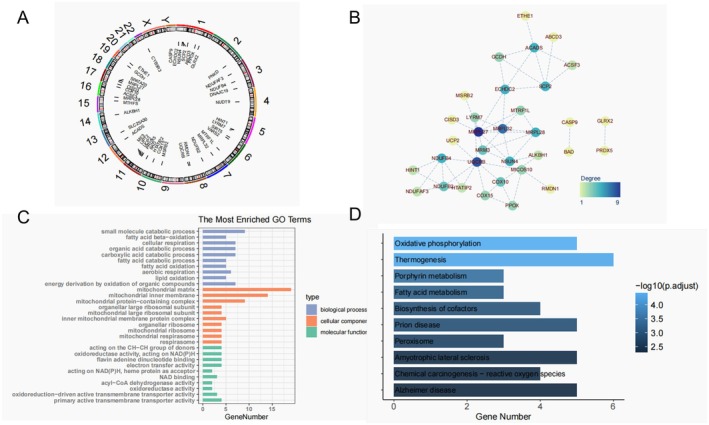
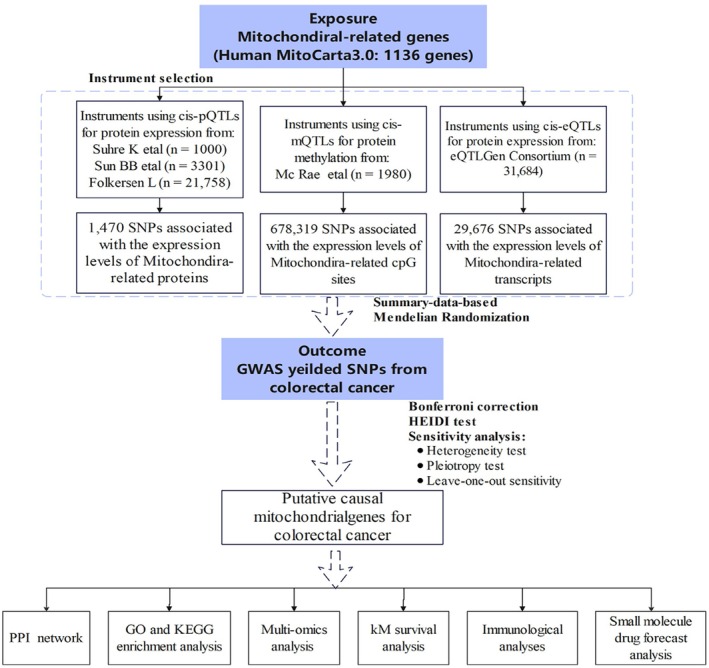
Materials and methods: We obtained 1136 MRGs from the MitoCarta3.0 database and analyzed the causal relationship between MRGs expression, methylation, and protein abundance and CRC by Mendelian randomization and sensitivity testing. Prognostic genes were screened via protein-protein interaction networks, enrichment, multi-omics, and survival analyses. Selected key genes were subjected to drug prediction analyses. The prognostic genes and immune cell correlations were explored using Spearman's correlation.

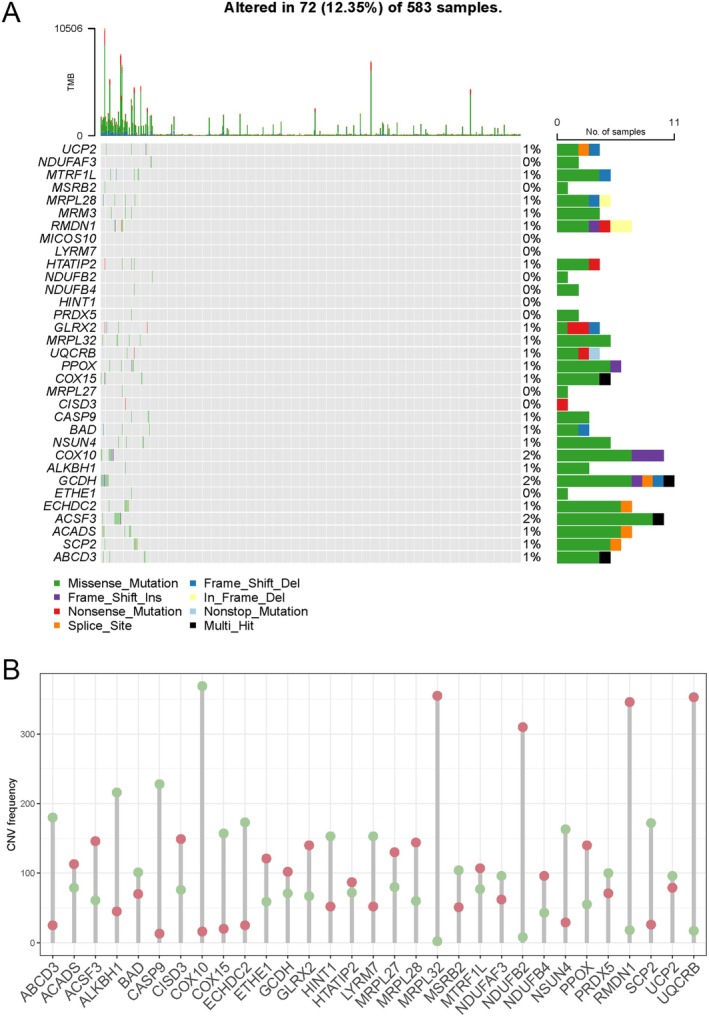
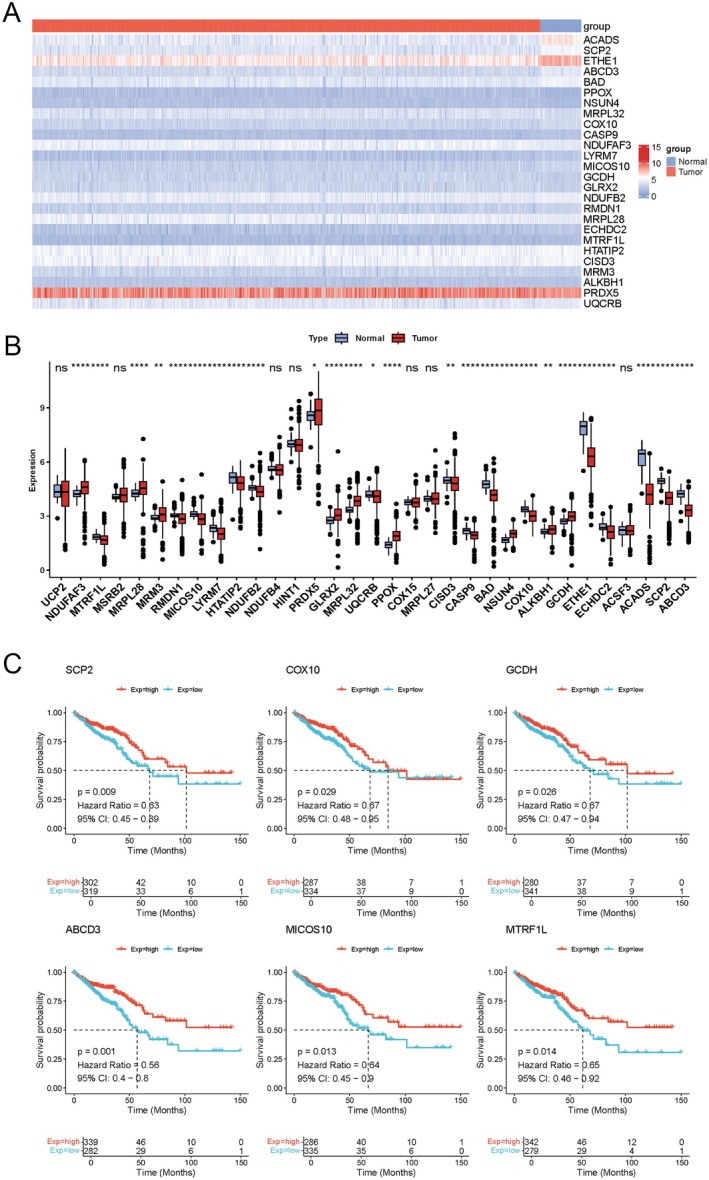
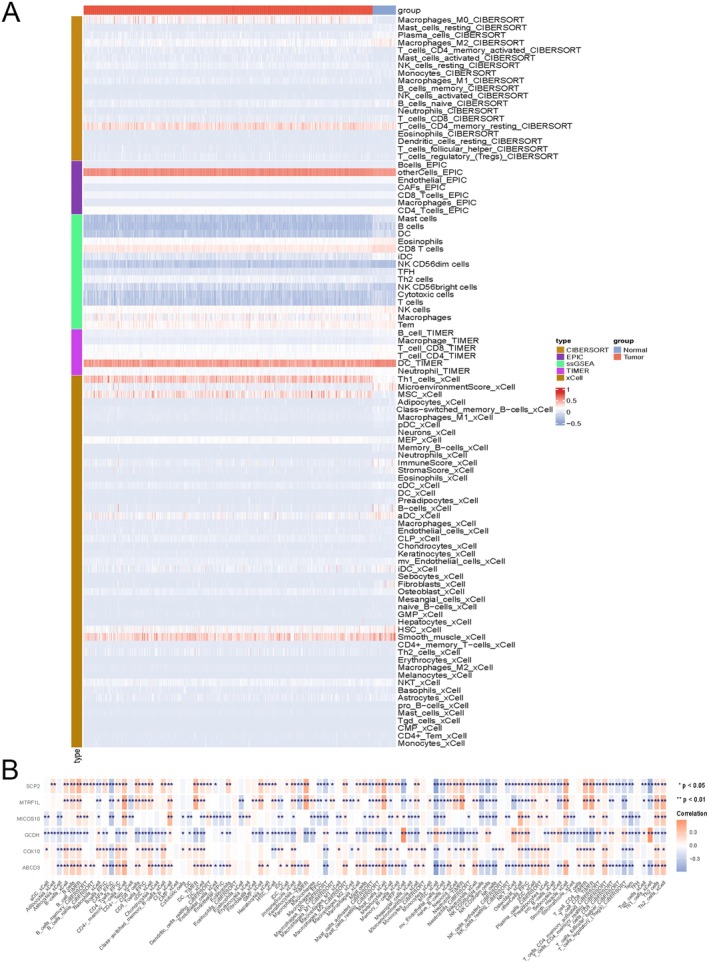
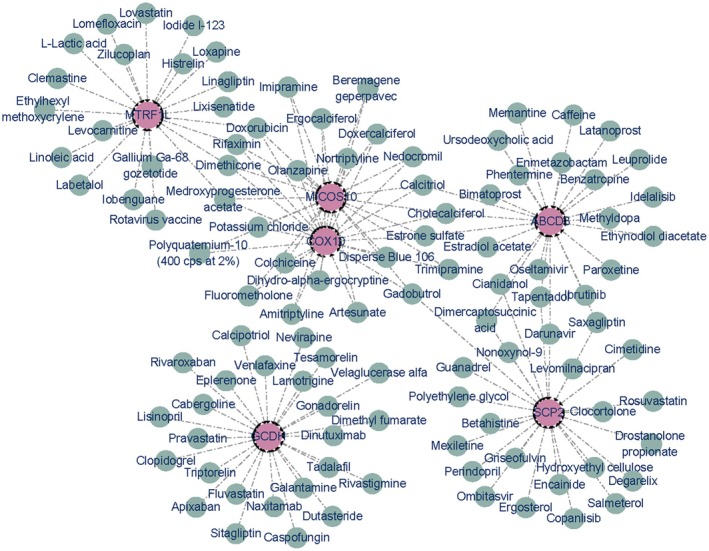
Results: The results indicated that 44 MRGs showed causal relationships with CRC. Six genes (sterol carrier protein2 [SCP2], ATP binding cassette subfamily D member 3 [ABCD3], cytochrome coxidase assembly factor heme A: farnesyltransferase [COX10], mitochondrial contact site and cristae organizing system subunit 10 [MiCOS 10], glutaryl-Coenzyme A dehydrogenase [GCDH], and mitochondrial translational release factor 1-like [MTRF1L] were causally associated with CRC and showed better prognostic significance when their expression levels were high, and there were 106 drugs targeting them. SCP2, ABCD3, MICOS10, GCDH, and MTRF1L were associated with most immune cells, while COX10 was not associated with any of the 96 immune cells.

Discussion: The identification of causal MRGs and their prognostic significance provides new insights into mitochondria's role in CRC. Drug prediction and immune correlations may guide therapy, but validation in larger cohorts and models is needed.

Conclusion: This study reveals causal associations between specific MRGs and CRC, identifies prognostic genes with therapeutic potential, and clarifies immune cell relationships, advancing CRC pathogenesis understanding and treatment development.

Keywords: Mendelian randomization; colorectal cancer; mitochondria‐related genes; potential targets; prognosis.


Conflict of interest statement

The authors declare no conflicts of interest.

Figures

FIGURE 1
FIGURE 1
MR results for the causal relationship between the MRGs eQTL and CRC risk. The OR value greater than 1 suggests that the exposure factor may elevate the risk of the outcome, while an OR value less than 1 implies that it may decrease the risk. When the OR value equals 1, it indicates no impact of the exposure factor on the outcome. The 95% CI indicates that we have a 95% confidence that the true value of the OR value falls within this interval. When the width of CI is narrow, it indicates that the estimation of OR value is more accurate. If the p value is lower than 0.05, it indicates that this causal association has statistical significance. ALKBH1, alkylation repair homolog 1; CI, confidence interval; GCDH, glutaryl‐CoA dehydrogenase; LYRM7, LYR motif containing 7; MRPL27, mitochondrial ribosomal protein L27; NDUFAF3, NADH ubiquinone oxidoreductase complex assembly factor 3; NDUFB2, NADH ubiquinone oxidoreductase subunit B2; OR, odds ratio; PPOX, protoporphyrinogen oxidase; PRDX5, peroxiredoxin 5; UCP2, uncoupling protein 2.
FIGURE 2
FIGURE 2
MR results for the causal relationship between the MRGs mQTL and CRC risk. The OR value greater than 1 suggests that the exposure factor may elevate the risk of the outcome, while an OR value less than 1 implies that it may decrease the risk. When the OR value equals 1, it indicates no impact of the exposure factor on the outcome. The 95% CI indicates that we have a 95% confidence that the true value of the OR value falls within this interval. When the width of CI is narrow, it indicates that the estimation of OR value is more accurate. If the p value is lower than 0.05, it indicates that this causal association has statistical significance. ABCD3, ATP binding cassette subfamily D member 3; ACADS, acyl‐CoA dehydrogenase short chain; ACSF3, acyl‐CoA synthetase family member 3; BAD, BCL2 associated agonist of cell death; CASP9, Caspase 9; CI, confidence interval; CISD3, CDGSH iron sulfur domain 3; COX10, cytochrome c oxidase assembly factor heme A, Farnesyltransferase COX10; COX15, cytochrome c oxidase assembly homolog COX15; CYB5R3, cytochrome b5 reductase 3; ECHDC2, enoyl‐CoA hydratase domain containing 2; LIPT2, lipoyl (octanoyl) transferase 2; ME3, Malic enzyme 3; MRPL28, mitochondrial ribosomal protein L28; MRPL32, mitochondrial ribosomal protein L32; MSRB2, methionine sulfoxide reductase B2; NSUN4, NOP2/Sun RNA methyltransferase 4; OR, odds ratio; PNKD, PNKD metallo‐beta‐lactamase domain containing; SCP2, sterol carrier protein 2; SLC25A30, solute carrier family 25 member 30; VARS2, valyl‐tRNA synthetase 2.
FIGURE 3
FIGURE 3
MR results for the causal relationship between the MRGs pQTL and CRC risk. The OR value greater than 1 suggests that the exposure factor may elevate the risk of the outcome, while an OR value less than 1 implies that it may decrease the risk. When the OR value equals 1, it indicates no impact of the exposure factor on the outcome. The 95% CI indicates that we have a 95% confidence that the true value of the OR value falls within this interval. When the width of CI is narrow, it indicates that the estimation of OR value is more accurate. If the p value is lower than 0.05, it indicates that this causal association has statistical significance. CI, confidence interval; DNAJC19, DnaJ heat shock protein family (Hsp40) member C19; ETHE1, ETHE1 persulfide dioxygenase; GLRX2, glutaredoxin 2; HINT1, histidine triad nucleotide binding protein 1; HTATIP2, HIV‐1 Tat interactive protein 2; MICOS10, mitochondrial contact site and cristae organizing system subunit 10; MRM3, mitochondrial rRNA methyltransferase 3; MTHFS, methenyltetrahydrofolate synthetase; MTRF1L, mitochondrial translation release factor 1 like; NDUFB4, NADH ubiquinone oxidoreductase subunit B4; NUDT9, nudix hydrolase 9; OR, odds ratio; RMDN1, regulator of microtubule dynamics 1; SIRT5, sirtuin 5; SPATA20, spermatogenesis associated 20; UQCRB, Ubiquinol‐cytochrome c reductase binding protein.
FIGURE 4
FIGURE 4
Results for PPI network and enrichment analysis of integrative genes. (A) Chromosomal localization of integrated genes. The position and length of each bar represent the position and length of the gene on the genome, respectively. (B) Integration of gene‐protein interaction networks. The depth of color indicates the degree size, and the darker the color, the greater the degree. (C) GO enrichment analysis of integrated genes. The horizontal axis represents the number of enriched genes, and the vertical axis represents the enriched entries. (D) KEGG enrichment analysis of the integrated genes. The horizontal axis represents the number of enriched genes, and the vertical axis represents the enriched entries.
FIGURE 5
FIGURE 5
Results for mutation identification and CNV of integrative genes. (A) Estimation of mutations in integrating genes. (B) Evaluation of CNV frequency in integrating genes. The red dots indicate a higher frequency of CNV for the gene, while the green dots indicate a lower frequency.
FIGURE 6
FIGURE 6
Results for expression profiling and survival analysis of integrative genes. (A) Heatmap of differentially integrated gene expression; (B) Differential analysis of integrated genes in normal and CRC tissues; (C) KM survival curves for integrated genes. *p < 0.05; **p < 0.01; ***p < 0.001; ****p < 0.0001.
FIGURE 7
FIGURE 7
Results for immunological analyses of integrated genes. (A) Heat map of differential immune cells. (B) Heatmap of the correlation between differentially integrated MRGs and differentially expressed immune cells. *p < 0.05; **p < 0.01; ***p < 0.001; ****p < 0.0001.
FIGURE 8
FIGURE 8
Results for small molecule drug prediction analyses of six prognostically significant genes.
FIGURE 9
FIGURE 9
Flowchart of the analyses performed.

Similar articles

References

    1. Sung H., Ferlay J., Siegel R. L., et al., “Global Cancer Statistics 2020: GLOBOCAN Estimates of Incidence and Mortality Worldwide for 36 Cancers in 185 Countries,” CA: a Cancer Journal for Clinicians 71, no. 3 (2021): 209–249, 10.3322/caac.21660 . - DOI - PubMed
    1. Bray F., Ferlay J., Soerjomataram I., Siegel R. L., Torre L. A., and Jemal A., “Global Cancer Statistics 2018: GLOBOCAN Estimates of Incidence and Mortality Worldwide for 36 Cancers in 185 Countries,” CA: a Cancer Journal for Clinicians 68, no. 6 (2018): 394–424, 10.3322/caac.21492 . - DOI - PubMed
    1. de Assis J. V., Coutinho L. A., Oyeyemi I. T., Oyeyemi O. T., and Grenfell R., “Diagnostic and Therapeutic Biomarkers in Colorectal Cancer: A Review,” American Journal of Cancer Research 12, no. 2 (2022): 661–680. - PMC - PubMed
    1. Xi Y. and Xu P., “Global Colorectal Cancer Burden in 2020 and Projections to 2040,” Translational Oncology 14, no. 10 (2021): 101174, 10.1016/j.tranon.2021.101174 . - DOI - PMC - PubMed
    1. Dekker E., Tanis P. J., Vleugels J. L. A., Kasi P. M., and Wallace M. B., “Colorectal cancer,” Lancet 394, no. 10207 (2019): 1467–1480, 10.1016/s0140-6736(19)32319-0 . - DOI - PubMed

MeSH terms