. 2025 Jul;14(7):e70119.
doi: 10.1002/jev2.70119.

Small and Large Extracellular Vesicles From Human Preovulatory Follicular Fluid Display Distinct ncRNA Cargo Profiles and Differential Effects on KGN Granulosa Cells

Affiliations

Small and Large Extracellular Vesicles From Human Preovulatory Follicular Fluid Display Distinct ncRNA Cargo Profiles and Differential Effects on KGN Granulosa Cells

Inge Varik et al. J Extracell Vesicles. 2025 Jul.

Abstract

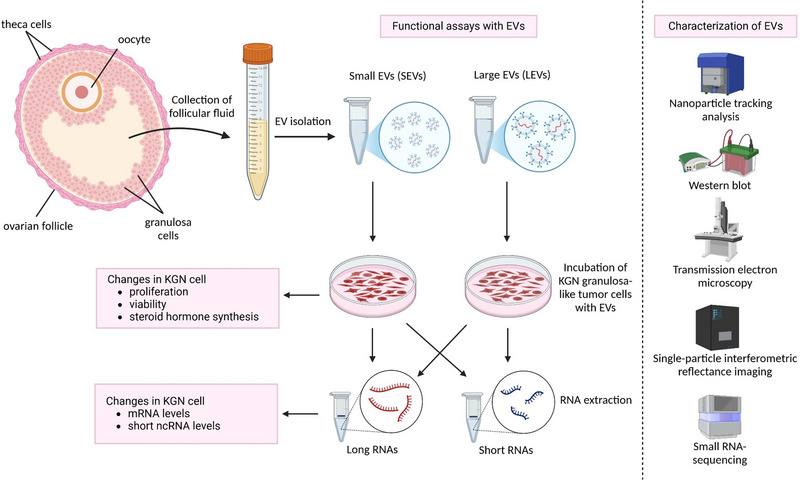
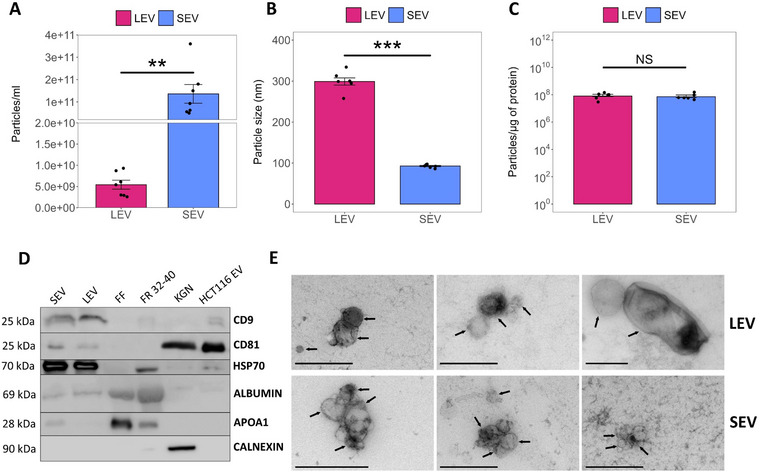
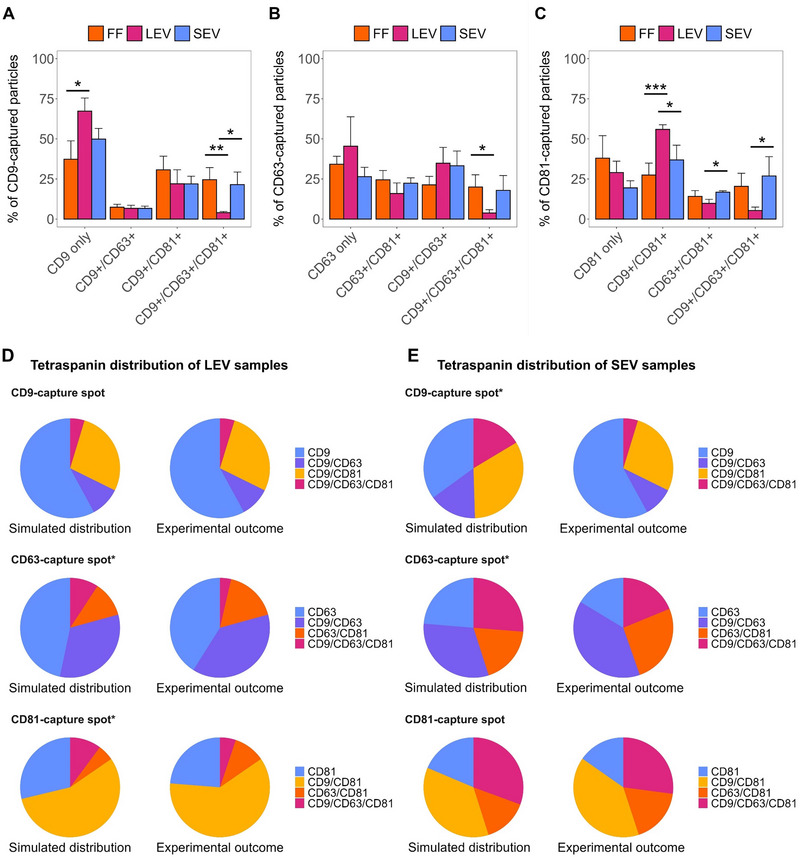
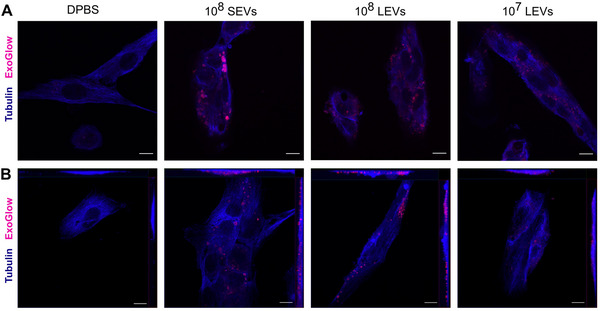
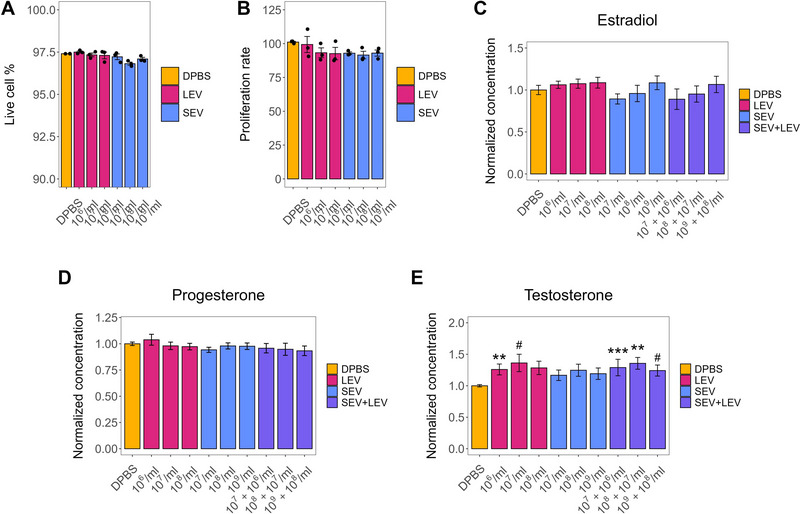
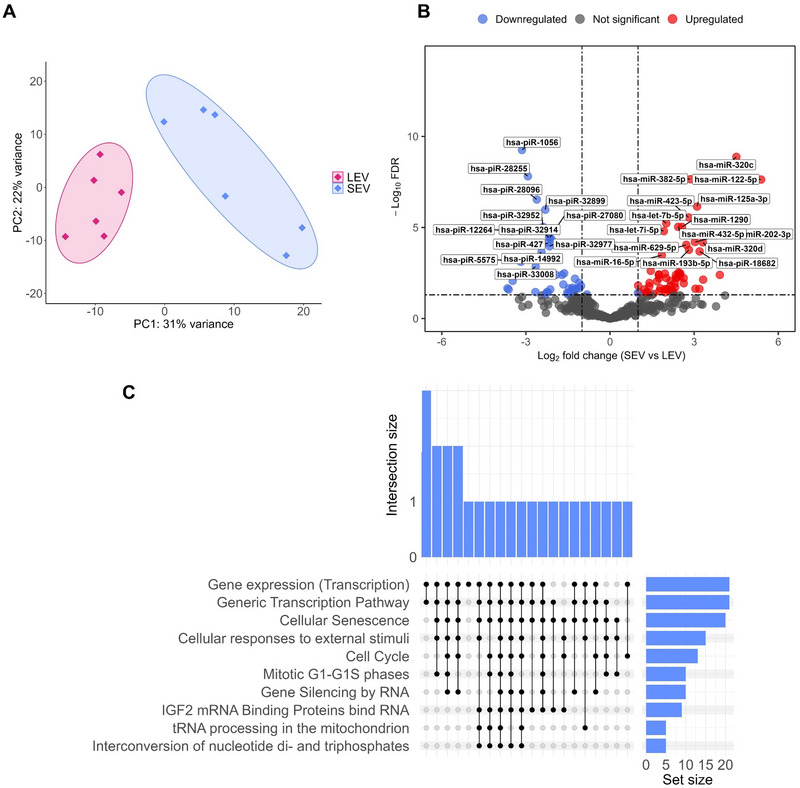
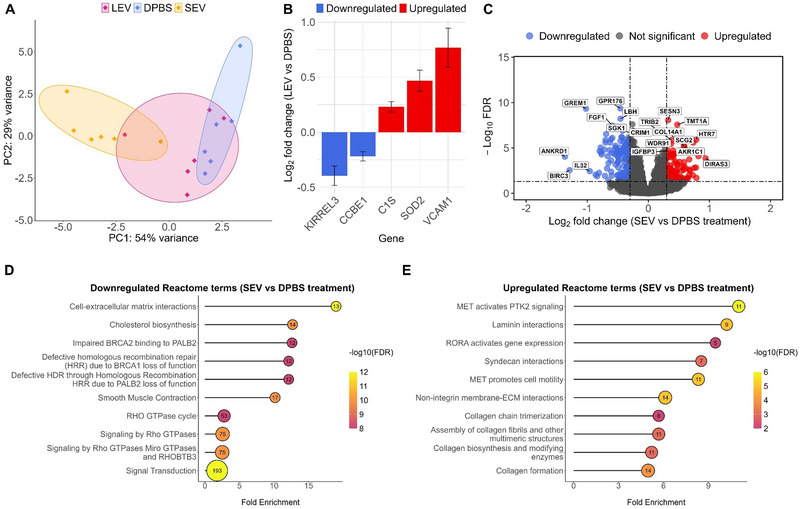
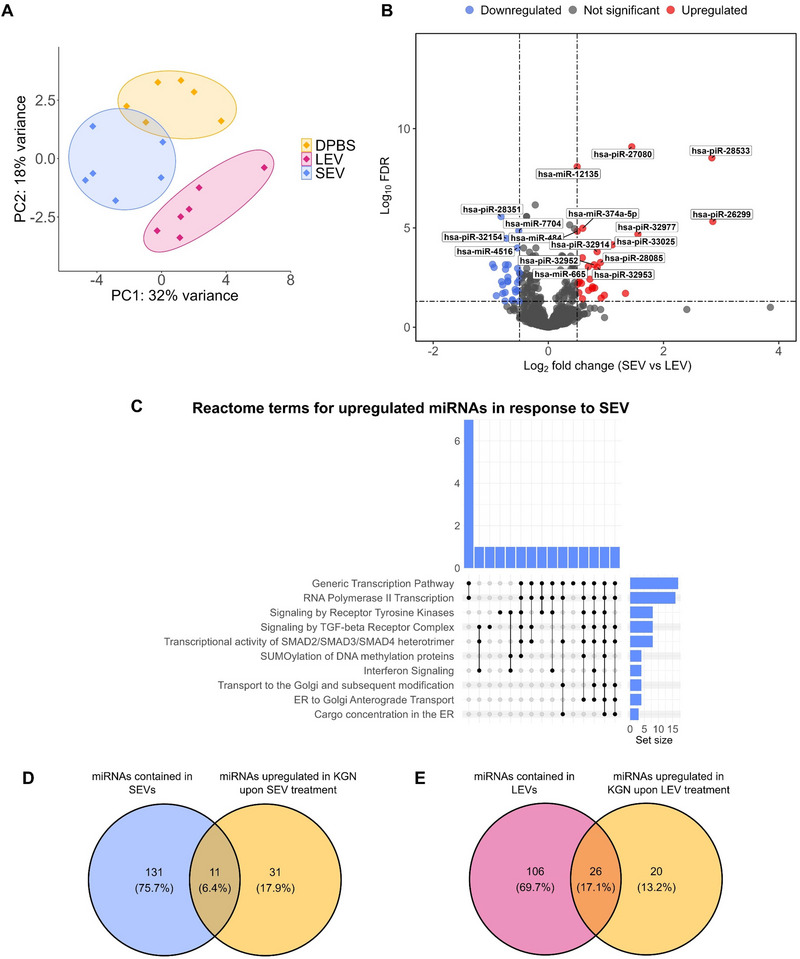
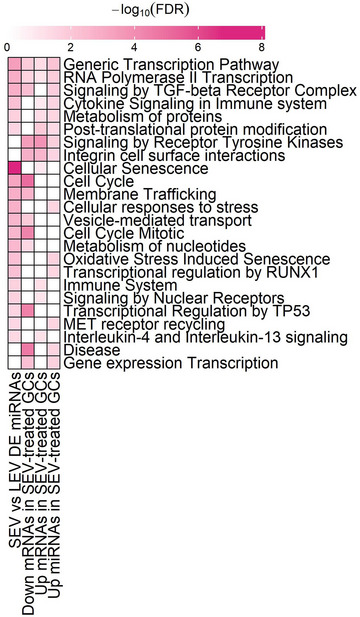
Follicular fluid extracellular vesicles (FF EVs) facilitate communication between oocytes and somatic cells within the ovarian follicle, playing a pivotal role in follicular development. This study highlights the molecular and functional distinctions between small (SEV) and large (LEV) FF EV subpopulations, revealing their specialised regulatory roles in granulosa cell (GC) biology and their consequential impact on ovarian function. Single-EV profiling uncovered distinct tetraspanin distributions, with LEVs containing a lower proportion of CD9/CD63/CD81-positive particles compared to SEVs. Fluorescent labelling confirmed uptake of both SEVs and LEVs by GCs, supporting their capacity to impact cellular behaviour. Functionally, LEVs increased testosterone production by GCs, whilst SEVs had no effect on steroid hormone secretion, suggesting a specific role for LEVs in androgen biosynthesis. Transcriptomic analysis revealed extensive SEV-induced changes in GC gene expression, affecting pathways involved in transcription, TGF-β signalling, extracellular matrix (ECM) remodelling and cell cycle regulation. In contrast, LEVs elicited minimal transcriptional changes, primarily modulating genes associated with immune regulation and oxidative stress defence. Small RNA sequencing further revealed distinct non-coding RNA (ncRNA) profiles, with SEVs enriched in miRNAs targeting pathways critical for GC differentiation, whilst LEVs carried higher levels of piRNAs implicated in maintaining genomic stability. These findings advance our understanding of FF EV-mediated intercellular communication and underscore the importance of investigating EV subpopulations independently.

Keywords: extracellular vesicles; follicular fluid; granulosa cells; miRNA; ncRNA; ovary.


Conflict of interest statement

Paolo Guazzi is the Chief Operating Officer at HansaBioMed Life Sciences. All other authors declare no conflicts of interest.

Figures

FIGURE 1
FIGURE 1
Study design. Extracellular vesicles were isolated from human ovarian follicles and separated based on size. Small and large EVs were characterised with multiple methods. Functional studies were carried out on the KGN cell line serving as a homogenous granulosa cell model. Created in BioRender. Varik, I. (2025) https://BioRender.com/p12h544.
FIGURE 2
FIGURE 2
Characterisation of small (SEV) and large (LEV) extracellular vesicles purified from human FF (n = 6). Mean particle concentrations (A), diameters (B), and purity (C) of SEV and LEV samples. (D) Western blot analysis showing EV (CD9, CD81 and HSP70) and non‐EV proteins (albumin, APOA1 and calnexin). FF and protein fractions (FR 32–40) served as a positive control for the detection of albumin and APOA1. KGN cell lysate was used as a positive control for detecting calnexin. Commercial EVs isolated from the HCT116 cell line served as a positive control for EV protein detection. (E) Transmission electron microscopy images of SEV and LEV samples. EVs are indicated by arrows, scale bar = 500 nm. All results are shown as mean ± SEM. Statistical differences between groups were determined by Student's t‐test and are indicated with asterisks (**p < 0.01, ***p < 0.001). NS –= not significant.
FIGURE 3
FIGURE 3
Comparison of tetraspanin profiles of SEVs, LEVs and crude FF. SEVs (n = 4), LEVs (n = 3) and FF (n = 6) were loaded onto the ExoView Tetraspanin chips and analysed with the ExoView R100 scanner. Tetraspanin colocalisation fractions (mean percentage of all detected EVs ± SEM) are shown for the CD9‐capture spot (A), the CD63‐capture spot, (B) and the CD81‐capture spot (C). Statistical significance was determined using one‐way ANOVA, followed by Tukey's post‐hoc test (*p < 0.05, **p < 0.01, ***p < 0.001). (D) Comparison of tetraspanin distribution between the simulated and experimental values for LEV samples and (E) SEV samples. Capture spots for which Chi‐square test between simulated and experimental colocalisation ratios resulted in p < 0.05 (indicating deviation from random colocalisation), are shown with asterisks (*).
FIGURE 4
FIGURE 4
Internalisation of FF‐derived EVs by KGN cells. KGN cells were treated with 10⁸ SEVs, 10⁸ LEVs, or 10⁷ LEVs for 6 h after labelling EVs with ExoGlow membrane dye (red), followed by a purification step to remove excess dye. As a negative control, cells were incubated with dye‐containing DPBS that underwent the same purification procedure. Tubulin staining (blue) was used to visualise cell structure. (A) Confocal images of a single plane. (B) Maximum intensity projections of the z‐stack optical sections. Scale bar = 10 µm.
FIGURE 5
FIGURE 5
Effects of SEVs and LEVs on KGN cell viability, proliferation and steroid hormone synthesis. For steroid hormone measurements, KGN cells were treated with increasing concentrations of SEVs (n = 12), LEVs (n = 12), a combination of SEVs and LEVs (n = 6) or DPBS (n = 12) for 24 h. For viability and proliferation measurements, cells were treated with SEVs (n = 3), LEVs (n = 3) or DPBS (n = 3) for 48 h. After the treatment, cell viability (A), proliferation (B), and the synthesis of oestradiol (C), progesterone (D), and testosterone (E) were assessed. All results are shown as mean ± SEM. Statistical significance was determined using the Mann‐Whitney U‐test (#p < 0.1, **p < 0.01, ***p < 0.001).
FIGURE 6
FIGURE 6
Identification of differentially expressed (DE) small noncoding RNAs between FF EV subpopulations. (A) PCA based on all miRNAs and piRNAs detected in SEV (n = 6) and LEV samples (n = 6). (B) DE miRNAs and piRNAs between SEV and LEV samples. RNAs that are more abundant (log2 fold change >1) in SEVs are indicated by red dots, whereas those more abundant (log2 fold change <−1) in LEVs are indicated by blue dots. (C) Top 10 enriched pathways for DE miRNAs identified via miEAA over‐representation analysis using the Reactome database. Interaction size represents the number of shared miRNAs among pathways. Set size represents the number of DE miRNAs annotated to a specific pathway.
FIGURE 7
FIGURE 7
Identification of differentially expressed genes (DEGs) in KGN cells treated with SEVs (n = 6), LEVs (n = 6) or DPBS (n = 6). (A) PCA of mRNA expression data from KGN cells treated with SEVs, LEVs or DPBS. (B) Log2 fold change values for statistically significant (FDR <0.05) DEGs between LEV and DPBS treatments (mean ± SEM). (C) Volcano plot showing DEGs upon SEV treatment, compared to DPBS‐treatment. Red dots represent upregulated DEGs (log2 fold change >0.3), and blue dots represent downregulated DEGs (log2 fold change <−0.3) with FDR <0.05. (D) Top 10 Reactome terms (FDR <0.05) enriched with downregulated genes between SEV and DPBS treatments. (E) Top 10 Reactome terms (FDR <0.05) enriched with upregulated genes between SEV and DPBS treatments. The number of DEGs observed by comparing SEV versus DPBS in each pathway is noted within circles in D and E.
FIGURE 8
FIGURE 8
Identification of DE ncRNAs in KGN cells treated with SEVs (n = 6), LEVs (n = 6) or DPBS (n = 6). (A) PCA based on piRNA and miRNA expression levels of KGN cells treated with SEVs, LEVs or DPBS. (B) Volcano plot showing DE ncRNAs between SEV and LEV treatments. Red dots represent upregulated ncRNAs in SEVs (log2 fold change >0.3), and blue dots represent upregulated ncRNAs in LEVs (log2 fold change <−0.3) with FDR <0.05. (C) Top 10 Reactome terms for upregulated miRNAs in response to SEV treatment. Reactome terms were identified via miEAA over‐representation analysis. Interaction size represents the number of shared miRNAs. Set size represents the number of miRNAs annotated to a specific pathway. (D) Overlap between miRNAs upregulated in KGN cells upon SEV treatment and miRNAs contained in SEVs. (E) Overlap between miRNAs upregulated in KGN cells upon LEV treatment and miRNAs contained in LEVs.
FIGURE 9
FIGURE 9
Heatmap of statistically enriched Reactome terms associated with SEVs: DE miRNAs predominantly upregulated in SEVs compared to LEVs, downregulated mRNAs in SEV‐treated GCs, upregulated mRNAs in SEV‐treated GCs and upregulated miRNAs in SEV‐treated GCs. Colour intensities represent the −log10(FDR) values for each Reactome term.

Similar articles

References

    1. Abramowicz, A. , and Story M. D.. 2020. “The Long and Short of It: The Emerging Roles of Non‐Coding RNA in Small Extracellular Vesicles.” Cancers 12, no. 6: 6. 10.3390/cancers12061445. - DOI - PMC - PubMed
    1. Anders, S. , Pyl P. T., and Huber W.. 2014. “HTSeq—A Python Framework to Work With High‐Throughput Sequencing Data.” Bioinformatics 31, no. 2: 166. 10.1093/bioinformatics/btu638. - DOI - PMC - PubMed
    1. Anderson, L. R. , Owens T. W., and Naylor M. J.. 2013. “Structural and Mechanical Functions of Integrins.” Biophysical Reviews 6, no. 2: 203–213. 10.1007/s12551-013-0124-0. - DOI - PMC - PubMed
    1. Andrews, S. 2010. FastQC: A Quality Control Tool for High Throughput Sequence Data . Available online at: http://www.bioinformatics.babraham.ac.uk/projects/fastqc.
    1. Backes, C. , Kehl T., Stöckel D., et al. 2017. “miRPathDB: A New Dictionary on microRNAs and Target Pathways.” Nucleic Acids Research 45: Database issue: D90–D96. 10.1093/nar/gkw926. - DOI - PMC - PubMed

Substances

LinkOut - more resources