

CT-derived functional imaging biomarkers combined with FEV1 for predicting 10-year all-cause mortality in COPDGene cohort
- PMID: 40620412
- PMCID: PMC12227309
- DOI: 10.1038/s44385-025-00027-9
CT-derived functional imaging biomarkers combined with FEV1 for predicting 10-year all-cause mortality in COPDGene cohort
Abstract
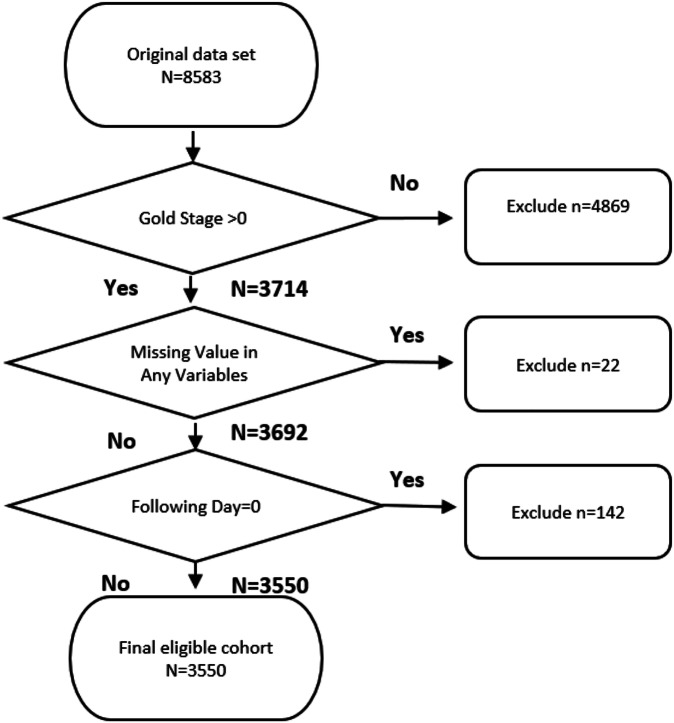
This study evaluates the predictive power of CT-derived functional imaging (CTFI) combined with forced expiratory volume in 1 second (FEV1) for 10-year all-cause mortality in COPD patients. We analyzed 8583 participants from the COPDGene® cohort, focusing on 3550 participants with spirometric obstruction. CTFI metrics, including ventilation (CT-V) and perfusion (PBM), were computed from non-contrast CT scans at lobar resolution. Our findings show that regional and global CTFI scores decline with advancing GOLD stages. A Random Survival Forest model, adjusted for age, BMI, and scanner type, demonstrated significant improvement in mortality prediction when combining FEV1 with CTFI, compared to FEV1 alone, with an AUC increase from 0.71 to 0.76 over 10 years. The Net Reclassification Index further confirmed the added predictive value of CTFI. These results suggest that integrating CTFI with traditional lung function measures enhances mortality prediction in COPD, offering a promising tool for clinical risk assessment.
Keywords: Medical research; Predictive markers.
© The Author(s) 2025.
Conflict of interest statement
Competing interestsEdward Castillo reports financial support was provided by National Heart Lung and Blood Institute. Girish Nair reports financial support was provided by National Heart Lung and Blood Institute. Lili Zhao reports financial support was provided by National Heart Lung and Blood Institute. Edward Castillo reports a relationship with 4D Medicine Ltd that includes: consulting or advisory and funding grants. Edward Castillo has patent #10932744 licensed to 4D Medical LTD. All other authors declare that they have no known competing financial interests or personal relationships that could have appeared to influence the work reported in this paper.
Figures


Similar articles
-
The comparative and added prognostic value of biomarkers to the Revised Cardiac Risk Index for preoperative prediction of major adverse cardiac events and all-cause mortality in patients who undergo noncardiac surgery.Cochrane Database Syst Rev. 2021 Dec 21;12(12):CD013139. doi: 10.1002/14651858.CD013139.pub2. Cochrane Database Syst Rev. 2021. PMID: 34931303 Free PMC article.
-
Machine learning for screening of at-risk, mild and moderate COPD patients at risk of FEV1 decline: results from COPDGene and SPIROMICS.Front Physiol. 2023 Apr 21;14:1144192. doi: 10.3389/fphys.2023.1144192. eCollection 2023. Front Physiol. 2023. PMID: 37153221 Free PMC article.
-
Deep Learning Estimation of Small Airway Disease from Inspiratory Chest Computed Tomography: Clinical Validation, Repeatability, and Associations with Adverse Clinical Outcomes in Chronic Obstructive Pulmonary Disease.Am J Respir Crit Care Med. 2025 Jul;211(7):1185-1195. doi: 10.1164/rccm.202409-1847OC. Am J Respir Crit Care Med. 2025. PMID: 40072247
-
FEV1 and DLCO predicting general complications but not prolonged air leaks in pulmonary segmentectomy.Ther Adv Respir Dis. 2025 Jan-Dec;19:17534666251341777. doi: 10.1177/17534666251341777. Epub 2025 Jul 7. Ther Adv Respir Dis. 2025. PMID: 40624919 Free PMC article.
-
Exercise versus airway clearance techniques for people with cystic fibrosis.Cochrane Database Syst Rev. 2022 Jun 22;6(6):CD013285. doi: 10.1002/14651858.CD013285.pub2. Cochrane Database Syst Rev. 2022. PMID: 35731672 Free PMC article.
References
-
- Celli Bartolome, R. et al. The Body-Mass Index, Airflow Obstruction, Dyspnea, and Exercise Capacity Index in Chronic Obstructive Pulmonary Disease. New Engl. J. Med.350, 1005–1012. 10.1056/NEJMoa021322. - PubMed
Grants and funding
LinkOut - more resources
Full Text Sources