. 2025 Apr 14;25(3):e19.
doi: 10.4110/in.2025.25.e19. eCollection 2025 Jun.

SiglecF Expressing Neutrophils Exacerbate Th17-Mediated Autoimmune Neuroinflammation

Affiliations

SiglecF Expressing Neutrophils Exacerbate Th17-Mediated Autoimmune Neuroinflammation

Wonseok Hu et al. Immune Netw. .

Abstract

Multiple sclerosis is an autoimmune disease characterized by numerous immune cells, including neutrophils, infiltrating the central nervous system. Previous reports point to a complex role for neutrophils in experimental autoimmune encephalomyelitis (EAE), where their heterogeneity remains poorly understood. In this study, we identified a unique population of neutrophils expressing SiglecF in the brain during EAE that can influence T cell activity. These neutrophils produced elevated levels of Th17-polarizing cytokines, including IL-6, IL-1β, IL-23, and TNF-α, both in vivo and in vitro. Consistent with this cytokine profile, co-culturing SiglecF+ neutrophils with CD4+ T cells promoted Th17 and GM-CSF+ pathogenic Th17 differentiation and proliferation while reducing regulatory T cell numbers. Depleting SiglecF+ neutrophils with anti-SiglecF Abs reduced the severity of EAE, decreased the Th17 population, and increased the regulatory T cell population in the brain. These findings suggest that SiglecF+ neutrophils promote autoimmune neuroinflammation by reinforcing pathogenic autoreactive Th17 cell responses.

Keywords: Autoimmune disease; Experimental autoimmune encephalomyelitis; Neutrophil heterogeneity; SiglecF+ neutrophil; Th17 cells.


Conflict of interest statement

Conflict of Interest: The authors declare no potential conflicts of interest.

Figures
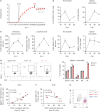
Figure 1
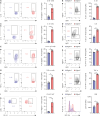
Figure 1. SiglecF+ neutrophils arise during EAE.
Ten- to eleven-week-old female C57BL/6 mice were immunized with MOG35-55/CFA emulsion. (A) EAE clinical scores for each mouse were measured daily. (B, C) Mice with EAE were sacrificed on day 10, 15, 20, and 25 after immunization and immune cells from brain were analyzed using flow cytometry (n=4–5 for each day). (B) Frequency of CD45highCD11b+Ly6G+ neutrophil and SiglecF+ neutrophil populations. (C) Absolute numbers of CD45high cells, CD45highCD11b- cells, CD45highCD11b+Ly6G+ neutrophils and SiglecF+ neutrophils. (D) Mice with EAE were sacrificed at the peak of disease. Frequency of SiglecF+ neutrophils from CD45highCD11b+Ly6G+ neutrophils in various tissues were assessed by flow cytometry. (E, F) Pearson correlation analysis between the frequency of SiglecF+ neutrophils (E) or neutrophils (F) with CD11b lymphoid cells. Each dot in graph was from each mouse sacrificed at day 10, 15, 20, or 25 after immunization. (G) Histogram showing Ly6G and SSC-A of Ly6GSiglecF+ eosinophils (grey), SiglecF neutrophils (blue) and SiglecF + neutrophils (red). The p-values were calculated by Student’s t-test or one-way ANOVA. d.p.i., dots per inch; FMO, fluorescence minus one; LN, lymph node; BM, bone marrow; spleen; SSC-A, side scatter area. *p<0.05; **p<0.01; ****p<0.0001.
Figure 2
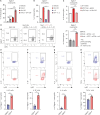
Figure 2. Cytokine profiles of SiglecF+ neutrophils in the brain during EAE.
Ten- to eleven-week-old female C57BL/6 mice were immunized with MOG35-55/CFA emulsion. Mice were sacrificed on day 15–25 after immunization and immune cells from brain were isolated to confirm cytokine production. (A, C, E, G, I, J) Each histogram shown was gated from CD45highCD11b+Ly6G+SiglecF+ (red) or CD45highCD11b+Ly6G+SiglecF populations (blue). (B, D, F, H) Each histogram shown was gated from CD45highCD11b+Ly6G+ and each cytokine positive population. Flow cytometric analysis of cytokine production of IL-23 (A, B), IL-6 (C, D), IL-1β (E, F), and TNF-α (G, H) by SiglecF neutrophils and SiglecF+ neutrophils. (I, J) Flow cytometric analysis of cit-H3 (I) and ROS generation (J) by SiglecF neutrophils and SiglecF+ neutrophils. The p-values were calculated by Student’s t-test. cit-H3, citrullinated histone 3; DCF-DA, 2',7'-dichlorodihydrofluorescein diacetate; MFI, mean fluorescence intensity. *p<0.05; **p<0.01; ***p<0.001; ****p<0.0001.
Figure 3
Figure 3. In vitro analysis of SiglecF+ neutrophils.
(A-C) Flow cytometric analysis of SiglecF+ neutrophils derived from culturing bone marrow cells with TGF-β1 (10 ng/ml), GM-CSF (10 ng/ml) and TGF-β1 (10 ng/ml) + GM-CSF (10 ng/ml) (A, B) or culture medium from in vitro generated pathogenic Th17 treated with control IgG2a or anti-GM-CSF (10 μg/ml) (C). (D) Flow cytometric analysis of SiglecF+ neutrophils derived from culturing bone marrow cells with the indicated cytokines, anti-CD3ε Ab, or pathogenic Th17 cells (pTh17) at a 1: 1 ratio for 24 h. Each histogram was gated from CD11b+Ly6G+ cells. (E-H) Flow cytometric analysis of cytokine production of IL-23 (E), IL-6 (F), IL-1β (G), and TNF-α (H) of SiglecF neutrophils and SiglecF+ neutrophils. Each histogram shown was gated from CD45highCD11b+Ly6G+SiglecF+ (red) or CD45highCD11b+Ly6G+ SiglecF population (blue). The p-values were calculated by Student’s t-test or one-way ANOVA. *p<0.05; **p<0.01; ***p<0.001; ****p<0.0001.
Figure 4
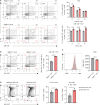
Figure 4. SiglecF+ neutrophils promote Th17 and GM-CSF+ pathogenic Th17 expansion.
(A-D) Isolated spleen-derived naïve CD4+ T cells and bone marrow-derived neutrophils were cultured as indicated. (A-C) FACS sorted SiglecF and SiglecF+ neutrophils were prepared on the day of co-culture or 1 day prior. SiglecF+ neutrophils were induced using GM-CSF (10 ng/ml) and TGF-β (10 ng/ml) for 24 h. Flow cytometric analysis of differentiation of Th17 and GM-CSF+ pathogenic Th17 (A). Flow cytometric analysis of Th17 and GM-CSF+ pathogenic Th17 (B) and proliferation (C). (D) Flow cytometric analysis of Th17 and GM-CSF+ pathogenic Th17. The p-values were calculated by Student’s t-test or one-way ANOVA. *p<0.05; **p<0.01; ***p<0.001; ****p<0.0001.
Figure 5
Figure 5. SiglecF+ neutrophils suppress Treg.
Isolated spleen-derived naïve CD4+ T cells and bone marrow-derived neutrophils were cultured as indicated. (A, B) Experimental design (A) and flow cytometric analysis of Foxp3+ Treg and RORγt+ CD4+ T cells (B). (C, D) FACS sorted SiglecF and SiglecF+ neutrophils were prepared on the day of co-culture or 1 day prior. SiglecF+ neutrophils were induced using GM-CSF (10 ng/ml) and TGF-β (10 ng/ml) for 24 h. Experimental design (C) and flow cytometric analysis of Foxp3+ Treg (D). The p-values were calculated by Student’s t-test or one-way ANOVA. NS, not significant. *p<0.05; **p<0.01; ***p<0.001.
Figure 6
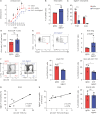
Figure 6. SiglecF+ neutrophil depletion using anti-SiglecF ameliorate Th17-transfer passive EAE.
(A-H) Splenocytes and lymph node cells were isolated from mice immunized with MOG35-55 emulsion and ex vivo restimulated using MOG35-55 (20 µg/ml) for 4 days with IL-23 (20 ng/ml) and IL-6 (20 ng/ml). Restimulated cells were transferred to 10–12 weeks-old Rag1 KO mice to induce EAE. IgG2a isotype control or anti-SiglecF (30 µg/head) were injected intraperitoneally at 2-day intervals, starting on day 8 after transfer. (A) EAE clinical scores. The combined results of two independent experiments are shown (n=6). (B, C) Flow cytometric analysis of neutrophils (B), SiglecF+ neutrophils (C). (D-F) Flow cytometric analysis of CD4+ T cells (D), Foxp3+ Treg (E), Th17 and GM-CSF+ Th17 (F). (G, H) Each dot on graph represents a mouse from the IgG2a isotype control and anti-SiglecF injected groups. Pearson correlation analysis between the frequency (G) and number (H) of SiglecF+ neutrophils and GM-CSF+ Th17. (I) Flow cytometric analysis of CD45highCD11b-B220+ B cells. The p-values were calculated by Student’s t-test or one-way ANOVA. d.p.t., day post transfer; NS, not significant. *p<0.05; **p<0.01; ****p<0.0001.

References

    1. Frischer JM, Bramow S, Dal-Bianco A, Lucchinetti CF, Rauschka H, Schmidbauer M, Laursen H, Sorensen PS, Lassmann H. The relation between inflammation and neurodegeneration in multiple sclerosis brains. Brain. 2009;132:1175–1189. - PMC - PubMed
    1. Dendrou CA, Fugger L, Friese MA. Immunopathology of multiple sclerosis. Nat Rev Immunol. 2015;15:545–558. - PubMed
    1. Liu R, Du S, Zhao L, Jain S, Sahay K, Rizvanov A, Lezhnyova V, Khaibullin T, Martynova E, Khaiboullina S, et al. Autoreactive lymphocytes in multiple sclerosis: pathogenesis and treatment target. Front Immunol. 2022;13:996469. - PMC - PubMed
    1. Baecher-Allan C, Kaskow BJ, Weiner HL. Multiple sclerosis: mechanisms and immunotherapy. Neuron. 2018;97:742–768. - PubMed
    1. Li R, Rezk A, Miyazaki Y, Hilgenberg E, Touil H, Shen P, Moore CS, Michel L, Althekair F, Rajasekharan S, et al. Proinflammatory GM-CSF-producing B cells in multiple sclerosis and B cell depletion therapy. Sci Transl Med. 2015;7:310ra166 - PubMed