. 2025 Jun 13;28(7):112893.
doi: 10.1016/j.isci.2025.112893. eCollection 2025 Jul 18.

Induction of hemagglutinin stalk reactive antibodies by the administration of a live-attenuated influenza virus vaccine in children

Affiliations

Induction of hemagglutinin stalk reactive antibodies by the administration of a live-attenuated influenza virus vaccine in children

Juan Manuel Carreño et al. iScience. .

Abstract

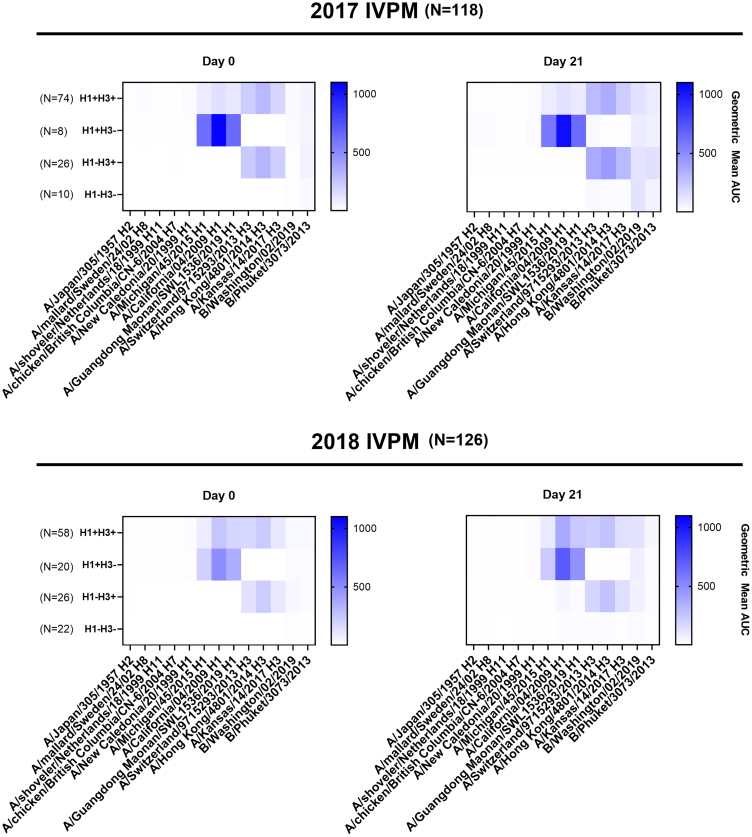
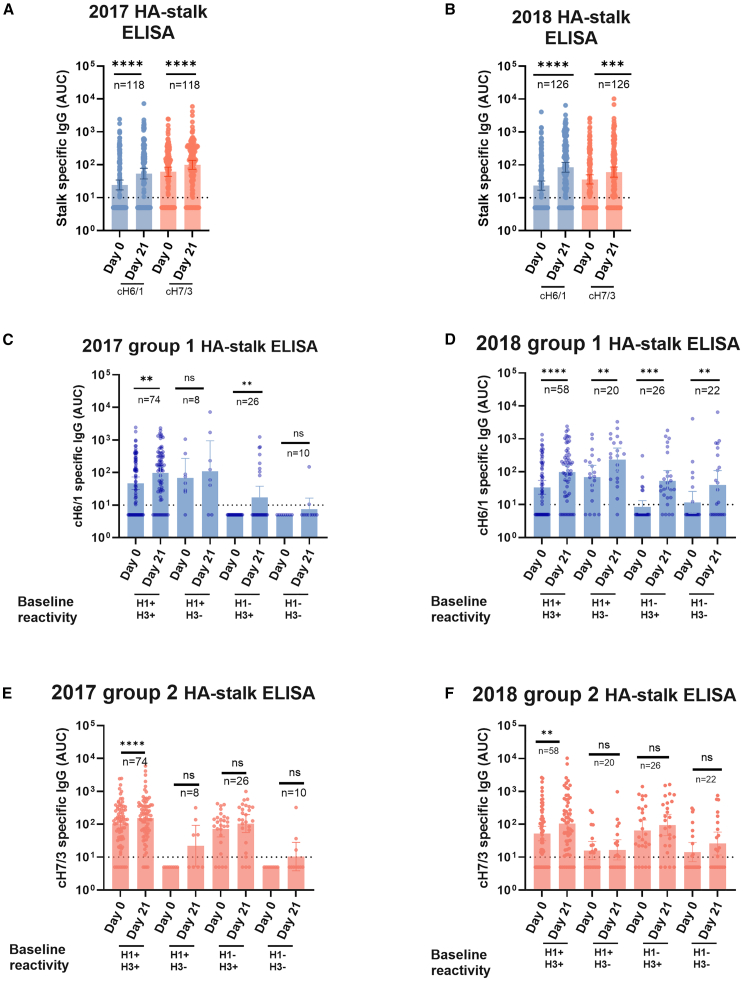
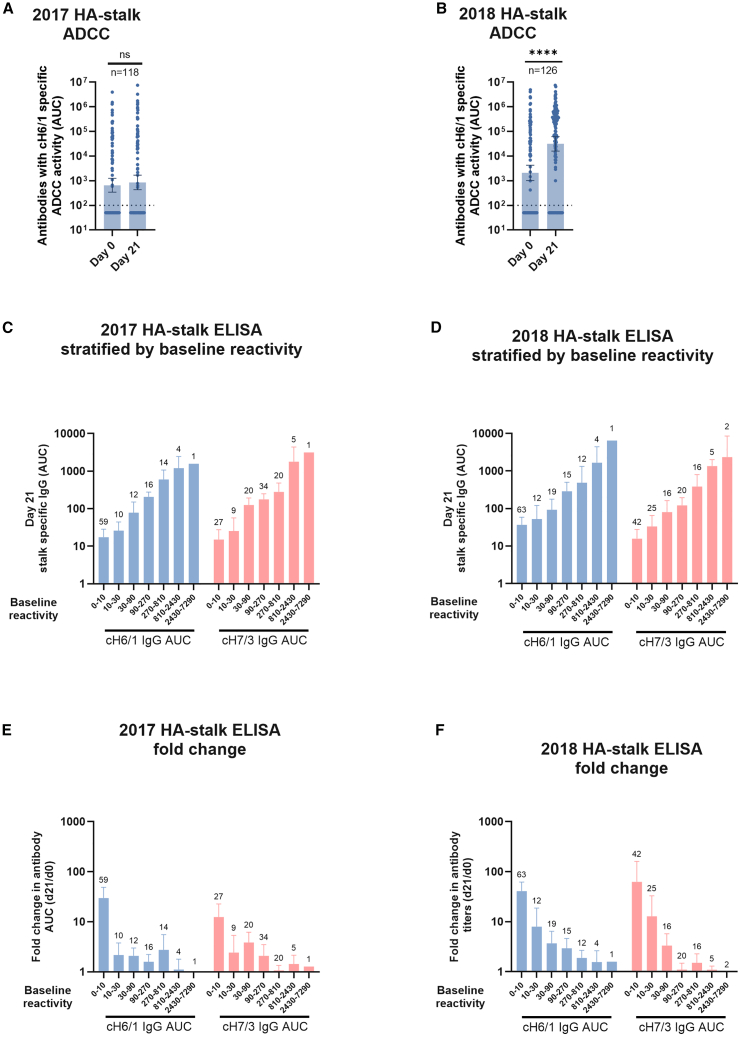
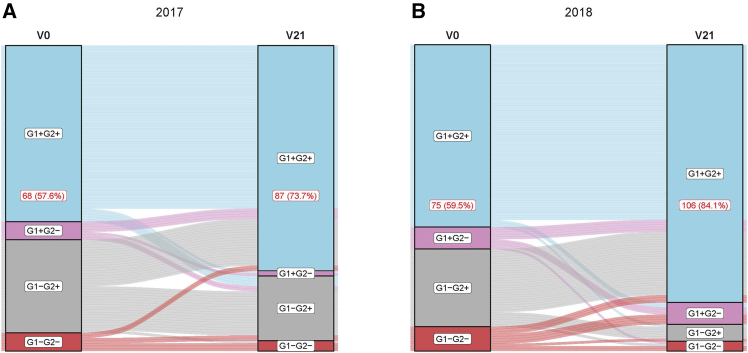
Early life exposures to influenza viruses may imprint a hemagglutinin group-specific signature on immunity that impacts future responses to infection or vaccination. We assessed the administration of a live attenuated influenza virus (LAIV) vaccine in children. Two LAIV formulations (2016-17 and 2017-18) containing distinct H1N1 components were used. Modest boosting of pre-existing serum stalk reactive titers and enhancement of functional antibody-dependent cellular cytotoxicity activity (ADCC) was observed. The magnitude of stalk antibody induction in children naive to influenza A viruses was low; however, LAIV induced de novo stalk antibodies, increasing the number of children seropositive to both group 1 (G1) and group 2 (G2) influenza viruses. The 2018 LAIV formulation, containing an updated H1N1 component, induced higher stalk reactive antibodies with strong ADCC effector functions to the G1 stalk. No significant changes were detected in NA-reactive antibodies in serum or in stalk- or NA-secretory IgA (sIgA) in oral fluid.

Keywords: Immunity.


Conflict of interest statement

The Icahn School of Medicine at Mount Sinai has filed patent applications regarding influenza virus vaccines on which FK is listed as an inventor. The Krammer laboratory has received support for influenza virus research in the past from GSK and is currently receiving support from Dynavax. FK is currently consulting for GSK, Third Rock Ventures, Pfizer, and Avimex.

Figures

None
Graphical abstract
Figure 1
Figure 1
Breadth of serum antibody reactivity in children stratified by baseline reactivity Antibody levels against a panel of group 1, group 2 or influenza B hemagglutinins (HAs) are shown. 118 and 126 samples from children of the 2016–17 or 2017–18 seasons, respectively, were analyzed. Baseline reactivity prior to LAIV administration to group 1 (H1+), group 2 (H3+), or influenza B viruses was measured by the presence of serum antibodies determined using an influenza virus protein microarray (IVPM). Antibody levels are expressed as geometric mean (GM) area under the curve (AUC) values. The GM AUC for a determined group is represented by a single rectangle in the heatmap. Blank rectangles are indicative of a lack of reactivity. For statistical comparisons, refer to Table S3.
Figure 2
Figure 2
Serum induction of stalk reactive antibodies by LAIV administration in children (A and B) Group 1 or group 2 stalk reactive antibodies were measured using chimeric hemagglutinins bearing the stalk domain of group 1 (cH6/1) or group 2 (cH7/3) influenza viruses. Samples from 118 to 126 children from the 2016-17 (left column) and 2017-18 (right column) season were analyzed. Baseline and post-vaccination (day 21) antibody levels are shown in (A) and (B). (C–F) Samples were stratified by infection exposure based on an influenza virus protein microarray (IVPM): baseline and post-vaccination antibodies against group 1 (C and D) or group 2 (E and F) stalk are shown. Bars represent the geometric mean AUC pre and post vaccination for every age group, and error bars indicate the 95% confidence interval. The horizontal dotted lines indicate the assay limit of detection (LoD); values below this threshold were assigned half the LoD. Statistical comparisons were performed using a Wilcoxon matched-paired signed-rank test: p < 0.05 was considered statistically significant with a 95% confidence level. Statistical differences between baseline and post vaccination levels are shown. ∗p ≤ 0.05, ∗∗p ≤ 0.01, ∗∗∗p ≤ 0.001, ∗∗∗∗p ≤ 0.0001. Numbers on top of every pair of bars indicate sample size.
Figure 3
Figure 3
Serum stalk reactive antibodies induced by LAIV administration display ADCC activity (A and B) Group 1 stalk reactive antibodies with ADCC activity were measured using an ADCC reporter assay in Madin-Darby canine kidney (MDCK) cells stably expressing the cH6/1 antigen on the surface. Baseline and post-vaccination antibody levels with ADCC activity to cH6/1 are shown in (A) and (B), respectively. (C–F) In (C–F), group 1 or group 2 stalk reactive antibodies were measured using chimeric hemagglutinins bearing the stalk domain of group 1 (cH6/1) or group 2 (cH7/3). Samples from participants were stratified by baseline reactivity (indicated in the X axis). Stalk reactive IgG levels induced by vaccination, expressed as area under the curve (AUC), are shown in (C) and (D) for the 2016–17 and 2017–18, respectively. Fold change in stalk reactive IgG, calculated as antibody levels at day 21 post-vaccination divided by baseline levels (d21/d0) is shown in E and F for the 2016–17 and 2017–18 seasons, respectively. Bars represent the geometric mean AUC (A–D) or geometric mean fold change (E–F). Error bars indicate the 95% confidence interval. Statistical comparisons were performed using a Kruskal-Wallis test corrected for multiple comparisons with Dunn’s post-test: p < 0.05 was considered statistically significant with a 95% confidence level. ∗∗∗∗p ≤ 0.0001, ns = not significant. Numbers on top of every pair of bars indicate sample size. The horizontal dotted lines in A and B indicate the assay limit of detection (LoD); values below this threshold were assigned half the LoD.
Figure 4
Figure 4
Changes in baseline seropositivity after LAIV administration Sankey plots depict changes from baseline stalk seropositivity measured by ELISA. Individuals were categorized based on their seropositivity profile to group 1 (G1+) or group 2 (G2+) hemagglutinin (HA) stalk: G1-G2-, G1-G2+, G2+G1-, or G1+G2+. Baseline (V0, to the left) and Day 21 post LAIV (V21, to the right) are shown. The links between nodes depict the proportion of changes from Baseline to Day 21 in the different reactivity groups.
Figure 5
Figure 5
Serum NA reactive antibodies and mucosal secretory IgA (sIgA) induced by vaccination (A and B) Group 1 or group 2 neuraminidase (NA) reactive antibodies were measured using recombinant N1 or N2 proteins. Baseline and post-vaccination antibody levels in samples from 118 to 126 children from the 2016–17 and 2017–18 seasons, respectively, are shown in (A) and (B), respectively. (C and D) In C and D samples from participants were stratified by baseline reactivity (indicated in the X axis). (E and F) In (E) and (F), fold change in NA reactive IgG was calculated as the levels at day 21 post-vaccination divided by baseline levels (d21/d0) for the 2016-17 (E) and 2017-18 (F) seasons respectively. (G and H) In (G–H), sIgA mucosal antibodies in oral fluid were measured against N1 neuraminidase, and cH6/1 or cH7/1 chimeric hemagglutinins (HAs). Baseline and post-vaccination antibody levels are shown. In A–B and G–H, the horizontal dotted lines indicate the assay limit of detection (LoD); values below this threshold were assigned half the LoD. Statistical comparisons were performed using a Wilcoxon matched-paired signed-rank test (A–B, G–H). p < 0.05 is considered statistically significant with a 95% confidence level. Statistical differences between baseline and post vaccination levels are shown. ns = not significant, ∗p ≤ 0.05, ∗∗p ≤ 0.01. Numbers on top of every pair of bars indicate sample size.

Similar articles

References

    1. Krammer F., Smith G.J.D., Fouchier R.A.M., Peiris M., Kedzierska K., Doherty P.C., Palese P., Shaw M.L., Treanor J., Webster R.G., García-Sastre A. Influenza. Nat. Rev. Dis. Primers. 2018;4:3. - PMC - PubMed
    1. Gostic K.M., Ambrose M., Worobey M., Lloyd-Smith J.O. Potent protection against H5N1 and H7N9 influenza via childhood hemagglutinin imprinting. Science. 2016;354:722–726. - PMC - PubMed
    1. Worobey M., Han G.Z., Rambaut A. Genesis and pathogenesis of the 1918 pandemic H1N1 influenza A virus. Proc. Natl. Acad. Sci. USA. 2014;111:8107–8112. - PMC - PubMed
    1. Arevalo P., McLean H.Q., Belongia E.A., Cobey S. Earliest infections predict the age distribution of seasonal influenza A cases. eLife. 2020;9 - PMC - PubMed
    1. Gostic K.M., Bridge R., Brady S., Viboud C., Worobey M., Lloyd-Smith J.O. Childhood immune imprinting to influenza A shapes birth year-specific risk during seasonal H1N1 and H3N2 epidemics. PLoS Pathog. 2019;15 - PMC - PubMed

LinkOut - more resources