. 2025 Jun 20:19:1602205.
doi: 10.3389/fnbeh.2025.1602205. eCollection 2025.

Quantifying social distance using deep learning-based video analysis: results from the BTBR mouse model of autism

Affiliations

Quantifying social distance using deep learning-based video analysis: results from the BTBR mouse model of autism

Tausif Khan et al. Front Behav Neurosci. .

Abstract

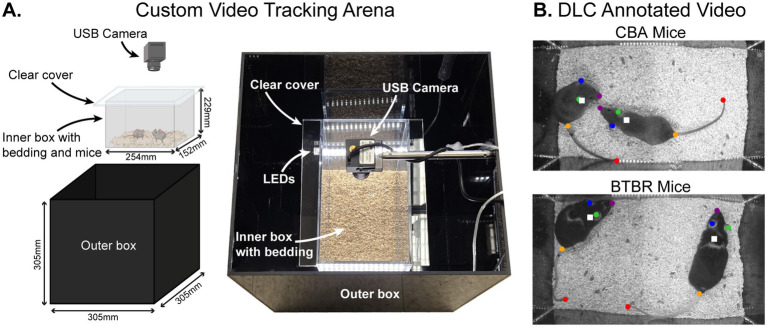
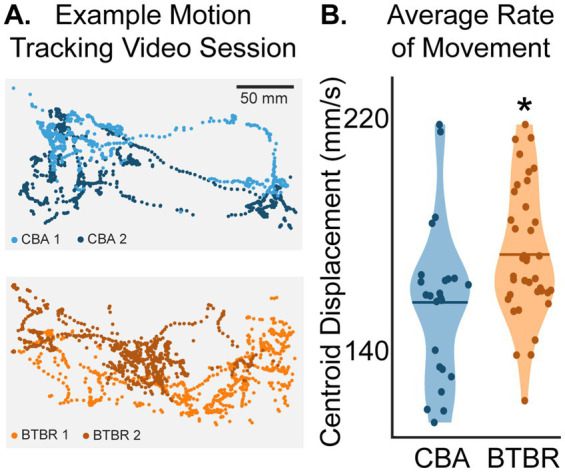
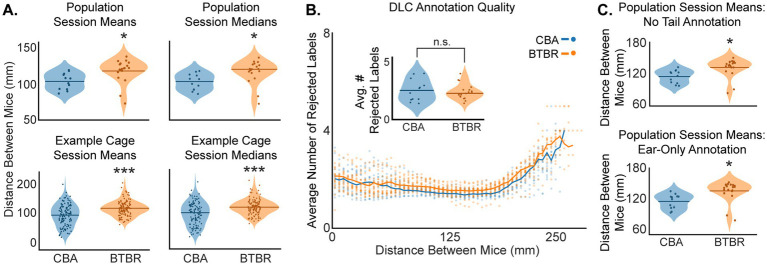
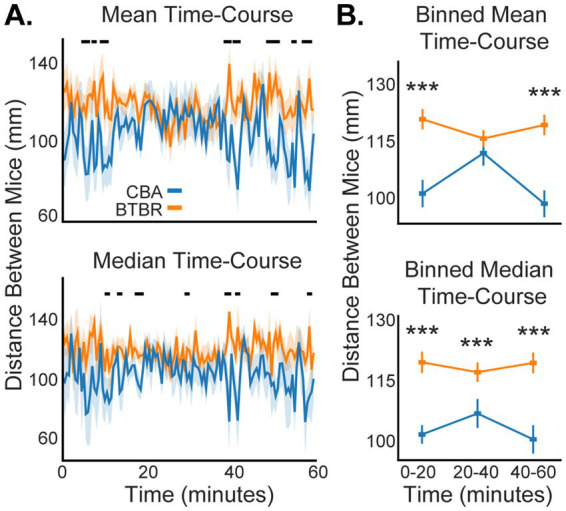
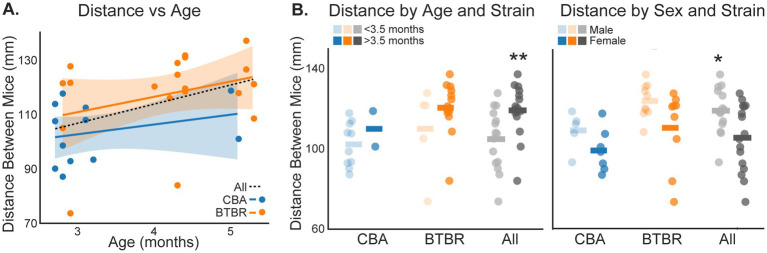
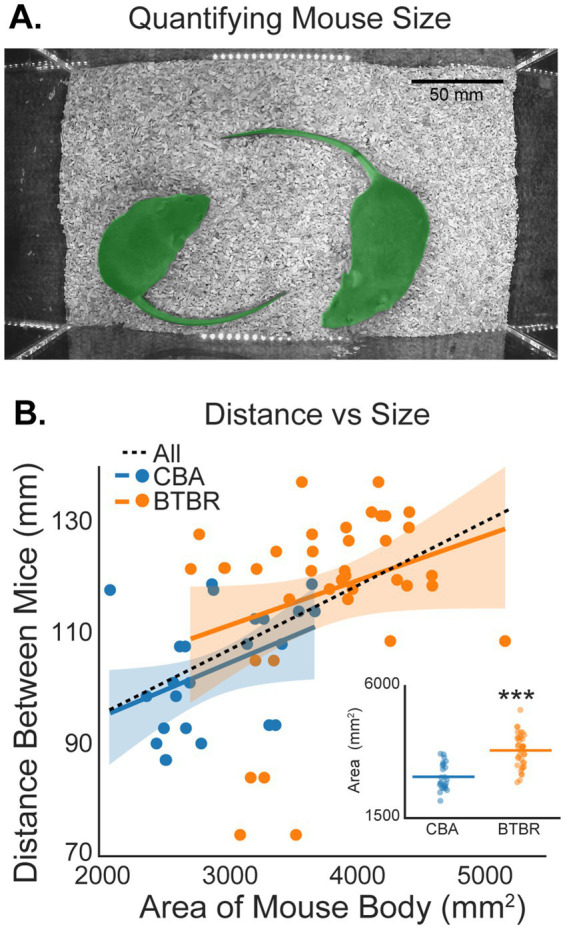
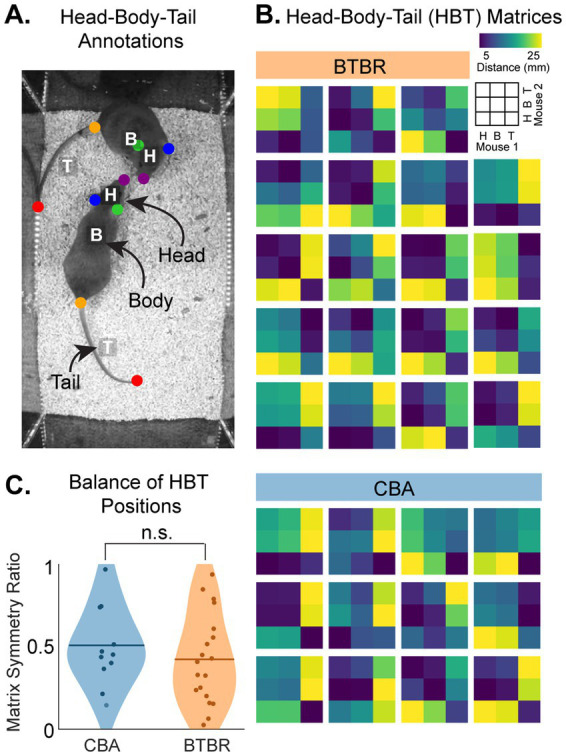
Autism spectrum disorder (ASD) is characterized by challenges in social communication, difficulties in understanding social cues, a tendency to perform repetitive behaviors, and restricted interests. BTBR T+ Itpr3tf/J (BTBR) mice exhibit ASD-like behavior and are often used to study the biological basis of ASD. Social behavior in BTBR mice is typically scored manually by experimenters, which limits the precision and accuracy of behavioral quantification. Recent advancements in deep learning-based tools for machine vision, such as DeepLabCut (DLC), enable automated tracking of individual mice housed in social groups. Here, we used DLC to measure locomotion and social distance in pairs of familiar mice. We quantified social distance by finding the Euclidean distance between pairs of tracked mice. BTBR mice showed hyperlocomotion and greater social distance than CBA control mice. BTBR social distance was consistently greater than CBA control mice across the duration of a 60-min experiment. Despite exhibiting greater social distance, BTBR mice showed comparable socio-spatial arrangements of heads, bodies, and tails compared to CBA control mice. We also found that age, sex, and body size may affect social distance. Our findings demonstrate that DeepLabCut facilitates the quantification of social distance in BTBR mice, providing a complementary tool for existing behavioral assays.

Keywords: BTBR; CBA; DeepLabCut; autism; mice; social distance.


Conflict of interest statement

The authors declare that the research was conducted in the absence of any commercial or financial relationships that could be construed as a potential conflict of interest.

Figures

Figure 1
Figure 1
Automated tracking of BTBR T+ Itpr3tf/J (BTBR) and CBA/CaJ (CBA) mouse behavior using a custom video tracking arena and DeepLabCut (DLC). (A) Custom video tracking arena. Pairs of mice were placed in a clear plastic inner box with bedding and a removable clear plastic cover. The inner box was placed within a lidless black plastic outer box. A USB camera was mounted onto the inside of the outer box, facing downward into the inner box to video the mice. (B) Example annotated mouse video. Pairs of mice in a cage were videoed for 1 h using the top-view camera. We used DLC to generate labeled body parts on each mouse (colored dots), and we calculated a frame-by-frame centroid of the body parts to yield a single point that tracked each mouse individually (white squares).
Figure 2
Figure 2
(A) Example plots of centroid positions across the 60-min video session. Each mouse is shown using a different color. Each dot (n = 900 for both BTBR and CBA mice) shows the frame-by-frame position of a mouse’s centroid across a 30 s epoch. (B) Average rate of movement across a video session. The star shows that BTBR centroid displacements were significantly greater than CBA mice (p = 0.045, bootstrap t-test with a Bonferroni correction for multiple comparisons of individual mice; n = 38 and 24 tracked BTBR and CBA mouse videos, respectively). The horizontal bars show the means of the distributions.
Figure 3
Figure 3
(A) BTBR mice show greater social distance than CBA mice. (A) Social distance means and medians across all cages (top row, n = 19 BTBR and 12 CBA cages), and for example cages (bottom row, n = 120 30 s epochs). We found the Euclidean distance between centroids to quantify social distance between pairs of mice in a cage. The stars show that BTBR mice kept a significantly greater distance between mice (top row, mean: p = 0.025, median: p = 0.035; bottom row, mean: p < 0.001, median: p < 0.001; bootstrap t-test). (B) DLC annotation quality was quantified as the average number of rejected body part labels across a video session. Here, it is shown as a function of distance between mice, binned in 5 mm increments. Each dot shows the value from a single video at each of the 120 epochs. The inset shows that the average number of rejected body part labels across all distances was not significantly different for CBA vs. BTBR mice (not significant: n.s.; p = 0.64, bootstrap t-test). (C) The top and bottom panels show that the trend in greater social distance for BTBR vs. CBA mice was robust to both the exclusion of DLC tail annotations (p = 0.014, bootstrap t-test) and the exclusive use of ear annotations in calculating centroids (p = 0.013, bootstrap t-test). n = 12 CBA and 19 BTBR cages.
Figure 4
Figure 4
Social distance dynamics across a 60-min video session. (A) Familiar BTBR mice show greater social distance than familiar CBA mice throughout an experiment. Shading shows 1 standard error of the mean (SEM). Black dots at the top of the plots show when significant differences occurred between BTBR vs. CBA mice (p < 0.05, bootstrap t-test). (B) We segmented the 60-min video session into three 20-min epochs to clarify the temporal stability of social distance. Stars show when BTBR mice had significantly greater distance between mice during an epoch (see Results for p-values, bootstrap t-test). n = 12 CBA and 19 BTBR cages.
Figure 5
Figure 5
Social distance depends on mouse age and sex. (A) Distance between mice plotted against the age of paired mice in each video session. The lines show linear fits to each dataset. The shading shows 2 SEMs. (B) The distance between mice for BTBR and CBA groups, and across all mice, was compared for mice <3.5 vs. > 3.5 months old (left panel), and for males vs. females (right panel). Horizontal bars show group means. Stars show significant differences for the All-mice group: <3.5 vs. > 3.5 month old mice (p = 0.009, bootstrap t-test) and males vs. females (p = 0.014, bootstrap t-test). n = 5 male and 7 female CBA mice. n = 10 male and 9 female BTBR mice. n = 10 < 3.5 and 2 > 3.5 month old CBA mice. n = 5 < 3.5 and 14 > 3.5 month old BTBR mice.
Figure 6
Figure 6
Social distance depends on mouse size. (A) Example of polygon masks (green overlaid on each mouse) used to estimate the size of each mouse in a video session. Masks were used to estimate the area (mm2) of each mouse. (B) The distance between mice plotted against the area of each mouse. Stars in the inset show that BTBR mice were significantly larger than CBA mice (p < 0.001, bootstrap t-test). n = 12 CBA and 19 BTBR cages.
Figure 7
Figure 7
BTBR and CBA mice show similarly balanced social interactions. (A) We quantified socio-spatial arrangements of mice using a reduced set of body parts in each mouse: Head (H), Body (B), and (Tail) (HBT). (B) HBT distance matrices. We measured the pairwise distances for H, (B), and T between the pair of mice in a cage (see color bar). The legend shows the HBT matrix pairwise comparisons. (C) The balance of socio-spatial arrangements between pairs of mice was quantified by finding the symmetry of each HBT matrix (see Methods). A symmetry ratio closer to 1 indicates greater asymmetry, i.e., disbalanced social interaction. 0 indicates perfect symmetry, i.e., balanced social interaction. We found similar symmetry ratios for both CBA and BTBR mice (p = 0.4, bootstrap t-test, n = 12 CBA and 19 BTBR cages).

Similar articles

References

    1. Alexander A. L., Lee J. E., Lazar M., Boudos R., DuBray M. B., Oakes T. R., et al. (2007). Diffusion tensor imaging of the corpus callosum in autism. NeuroImage 34, 61–73. doi: 10.1016/j.neuroimage.2006.08.032, PMID: - DOI - PubMed
    1. Amodeo D. A., Pahua A. E., Zarate M., Taylor J. A., Peterson S., Posadas R., et al. (2019). Differences in the expression of restricted repetitive behaviors in female and male BTBR T + tf/J mice. Behav. Brain Res. 372:112028. doi: 10.1016/j.bbr.2019.112028, PMID: - DOI - PubMed
    1. Avolio E., Olivito I., Leo A., De Matteo C., Guarnieri L., Bosco F., et al. (2024). Vasostatin-1 restores autistic disorders in an idiopathic autism model (BTBR T+ Itpr3(tf)/J mice) by decreasing hippocampal neuroinflammation. Prog. Neuro-Psychopharmacol. Biol. Psychiatry 135:111131. doi: 10.1016/j.pnpbp.2024.111131, PMID: - DOI - PubMed
    1. Bejerot S., Eriksson J. M., Mortberg E. (2014). Social anxiety in adult autism spectrum disorder. Psychiatry Res. 220, 705–707. doi: 10.1016/j.psychres.2014.08.030, PMID: - DOI - PubMed
    1. Bove M., Palmieri M. A., Santoro M., Agosti L. P., Gaetani S., Romano A., et al. (2024). Amygdalar neurotransmission alterations in the BTBR mice model of idiopathic autism. Transl. Psychiatry 14:193. doi: 10.1038/s41398-024-02905-z, PMID: - DOI - PMC - PubMed

LinkOut - more resources