. 2025 Jun 16;10(25):26935-26952.
doi: 10.1021/acsomega.5c01998. eCollection 2025 Jul 1.

Interaction of Anionic Surfactants with Native and Partially Unfolded RNase A: Binding Kinetics, Structural Changes, and Stability

Affiliations

Interaction of Anionic Surfactants with Native and Partially Unfolded RNase A: Binding Kinetics, Structural Changes, and Stability

Sanjay Kumar et al. ACS Omega. .

Abstract

In protein-surfactant interactions, the alkyl chain length of surfactants and the surface-exposed residues of proteins play essential roles in binding and unfolding. To investigate this, the interactions of sodium octyl (SOS), decyl (SDeS), and dodecyl (SDoS) sulfates were studied with native and partially unfolded forms of ribonuclease A (ox-RNase A and rd-RNase A) by using surface plasmon resonance (SPR), optical spectroscopy, and molecular dynamics (MD) simulations. rd-RNase A was obtained by partial reduction of the disulfide bonds of RNase A. MD simulations of RNase A in its native and unfolded states were carried out in the presence of all three surfactants in their monomeric and micellar concentrations, respectively. The binding affinity of surfactants differs between ox-RNase A and rd-RNase A. Monomeric forms of the surfactants do not affect the structure and stability of either form of RNase A. Upon micelle formation of the surfactants, ox-RNase A loses its tertiary interactions along with β-sheets. However, it forms non-native α-helices that gradually destabilize ox-RNase A. rd-RNase A initially forms more β-sheets, which stabilize the protein. Further increases in surfactant concentrations destabilize the β-sheets and induce the formation of non-native α-helices. MD simulation results suggest that rd-RNase A induces micelle formation with higher aggregation numbers than ox-RNase A. At monomeric concentrations, the interactions of surfactants could be predominantly ionic, whereas at micellar concentrations, hydrophobic interactions contribute significantly. The exposed hydrophobic surfaces of partially unfolded rd-RNase A facilitate binding of the surfactant to the protein. This results in differences in the unfolding pathways of rd-RNase A and ox-RNase A.


Figures

1
1
(A) Surfactant molecules, SOS, SDeS and SDoS, used in this study. Three-dimensional structures of different forms of RNase A: (B) native RNase A from PDB id: 7RSA (ox-RNase A) with all four disulfide bonds intact, (C) partially-reduced RNase A from PDB id: 1A5P (rd-RNase A) in which the C40–C95 disulfide bond is reduced, (D,E) unfolded forms of native and partially reduced RNase A obtained from REMD simulations, ox-RNase Aunf and rd-RNaseunf A, respectively (refer Section ). The triple-stranded β-sheet (strands A1–A3) and four-stranded β-sheet (strands B1–B4) are shown in light brown and cyan, respectively. The helices are marked as H1, H2, and H3, the β-loops are marked as βL1 and βL2, and the β-hairpins are marked as βh1, βh2, and βh3. Cys residues are colored yellow sticks.
2
2
Representative sensorgrams for the binding of SDoS with immobilized ox-RNase A and rd-RNase A obtained from (A1,A2) unistep, (B1,B2) bistep and (C1,C2) multistep SPR kinetic experiments, as described in Figure S1. The binding affinities (−log K D , where K D is the equilibrium dissociation constant) of SOS, SDeS, and SDoS to (A3-C3) ox-RNase A and (A4-C4) rd-RNase A calculated from their sensorgrams.
3
3
(A1–C1) Hydrodynamic diameter of ox-RNase A (cyan) and rd-RNase A (red) in the absence (dashed lines) and the presence of micellar concentrations of the surfactants (solid lines). Inset in A1: Size distribution of the micelles in the absence of protein. Inset in C1: Zeta potentials of ox-RNase A and rd-RNase in the absence and the presence of micelles (filled bars), and zeta potential of micelles without protein (gray crossed bars). (A2–C2) Intrinsic fluorescence intensity and (A3–C3) fluorescence anisotropy changes of ox-RNase A (cyan circles) and rd-RNase A (red circles) measured at 307 nm after exciting the protein at 280 nm in the presence of increasing concentrations of SOS, SDeS, and SDoS. The squares represent the fluorescence values of the proteins in the absence of surfactants. The dotted vertical lines and + represent the pre-CMC and CMC of the surfactants, respectively, in the presence of ox-RNase A (cyan) and rd-RNase A (red).
4
4
(A1–C1) Ellipticity changes of ox-RNase A (cyan circles) and rd-RNase A (red circles) at 278 nm obtained from their near-UV CD spectra (Figure S4) in the presence of increasing concentrations of the surfactants. The squares represent the ellipticity values of the proteins in the absence of surfactants. The secondary structure content of (A2–C2) ox-RNase A and (A3–C3) rd-RNase A in varying concentrations of SOS (cyan), SDeS (dark yellow), and SDoS (red) calculated from their respective far-UV CD spectra (Figure S4). The dotted vertical lines and + represent the pre-CMC and CMC of the surfactants, respectively, in the presence of protein.
5
5
(A,B) Thermal denaturation midpoint, T m and (C,D) enthalpy of unfolding, ΔH m of ox-RNase A (left panels) and rd-RNase A (right panels) in the absence (black squares) and the presence of varying concentrations SOS (cyan), SDeS (dark yellow), and SDoS (red). The dotted vertical lines and + represent the pre-CMC and CMC of the surfactants in the presence of protein, respectively.
6
6
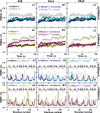
RMSD and RMSF values obtained from MD simulations: (A1–C1 and A3–C3) ox-RNase A and ox-RNase Aunf in the absence (black and gray, respectively) and the presence of monomeric (blue) and micellar (cyan) concentrations of the surfactants, respectively. (A2–C2 and A4–C4) rd-RNase A and rd-RNase Aunf in the absence (dark green and light green, respectively) and the presence of monomeric (red) and micellar (magenta) concentrations of the surfactants, respectively. The cartoons in plots A3–C4 represent the secondary structural elements of the protein across the residue number, and the structures are marked as the same in Figure B.
7
7
Radial distribution functions (RDF) of water around the heavy atoms of (A1) ox-RNase A and ox-RNase Aunf, and (A2) rd-RNase A and rd-RNase Aunf in the absence and the presence of monomeric (solid lines) and micellar (dashed lines) concentrations of the surfactants, respectively. (B1,B2) RDF of surfactants around the heavy atoms of the proteins in their monomeric and micellar concentrations. RDF plots were evaluated by separately considering the ionic moiety (C1,C2) and alkyl chain moiety (D1,D2) of the surfactants. The colors represent the absence (black) or the presence of SOS (blue), SDeS (green), or SDoS (red) in the simulation. The number of water and surfactant molecules around (A3–B3) ox-RNase A and (A4–B4) rd-RNase A in the absence (gray) and the presence of surfactants SOS (cyan), SDeS (dark yellow), and SDoS (red) in their monomeric (filled bars) and micellar (crossed-texture bars) concentrations was calculated at three different distances from the surface of the protein. Each surfactant was split into ionic moiety (C3,C4) and alkyl chain moiety (C4,D4), and their presence within the cutoff distance was calculated. As the number of surfactants in the first hydration shell (within 0.30 nm) is meager, it is not included in panels (B3–D4).
8
8
Normalized frequency distribution of each type of aggregate, small (gray), medium (dark yellow), large (cyan), and macro (magenta), formed by the micellar concentrations of the surfactants in water (A1–A3), on the surface of ox-RNase A (B1–B3) and rd-RNase A (C1–C3) during the last 60 ns of their respective MD simulations. The insets in each panel show the number of each aggregate across the simulation time (in ns).
9
9
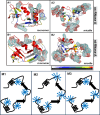
Representative binding sites of surfactants obtained from MD simulations of (A1) ox-RNase A in monomeric surfactants, (A2) ox-RNase Aunf in micelles, (B1) rd-RNase A in monomeric surfactants, and (B2) rd-RNase Aunf in micelles. The fraction of time surfactants bound to the protein is represented from blue (zero) to red (one) on the ribbon diagram of the protein. The surfactants are represented as meshes. The binding analysis for each surfactant is presented in Figures S16 and S17. Protein–surfactant interaction models (black chain, protein; blue sticks, anionic surfactants): (M1) micelles of the surfactants wrapping around the protein chain, (M2) surfactants forming micelles around the nucleation sites on the protein, and (M3) protein chain penetrates through the surfactant core and is wrapped around by micelles (flexible-helix micelle). The present study supports model, M1.

Similar articles

References

    1. Kralova I., Sjöblom J.. Surfactants Used in Food Industry: A Review. J. Dispers Sci. Technol. 2009;30(9):1363–1383. doi: 10.1080/01932690902735561. - DOI
    1. Shaban S. M., Kang J., Kim D.-H.. Surfactants: Recent Advances and Their Applications. Composites Communications. 2020;22:100537. doi: 10.1016/j.coco.2020.100537. - DOI
    1. Moon S. Y., Kusunose T., Sekino T.. CTAB-Assisted Synthesis of Size- and Shape-Controlled Gold Nanoparticles in SDS Aqueous Solution. Mater. Lett. 2009;63:2038–2040. doi: 10.1016/j.matlet.2009.06.047. - DOI
    1. He C., Ohnishi K.. Efficient Renaturation of Inclusion Body Proteins Denatured by SDS. Biochem. Biophys. Res. Commun. 2017;490(4):1250–1253. doi: 10.1016/j.bbrc.2017.07.003. - DOI - PubMed
    1. Schägger H.. Tricine–SDS-PAGE. Nat. Protoc. 2006;1(1):16–22. doi: 10.1038/nprot.2006.4. - DOI - PubMed

LinkOut - more resources