

Sensory Entrained TMS (seTMS) Enhances Motor Cortex Excitability
- PMID: 40622189
- PMCID: PMC12231655
- DOI: 10.1002/hbm.70267
Sensory Entrained TMS (seTMS) Enhances Motor Cortex Excitability
Abstract
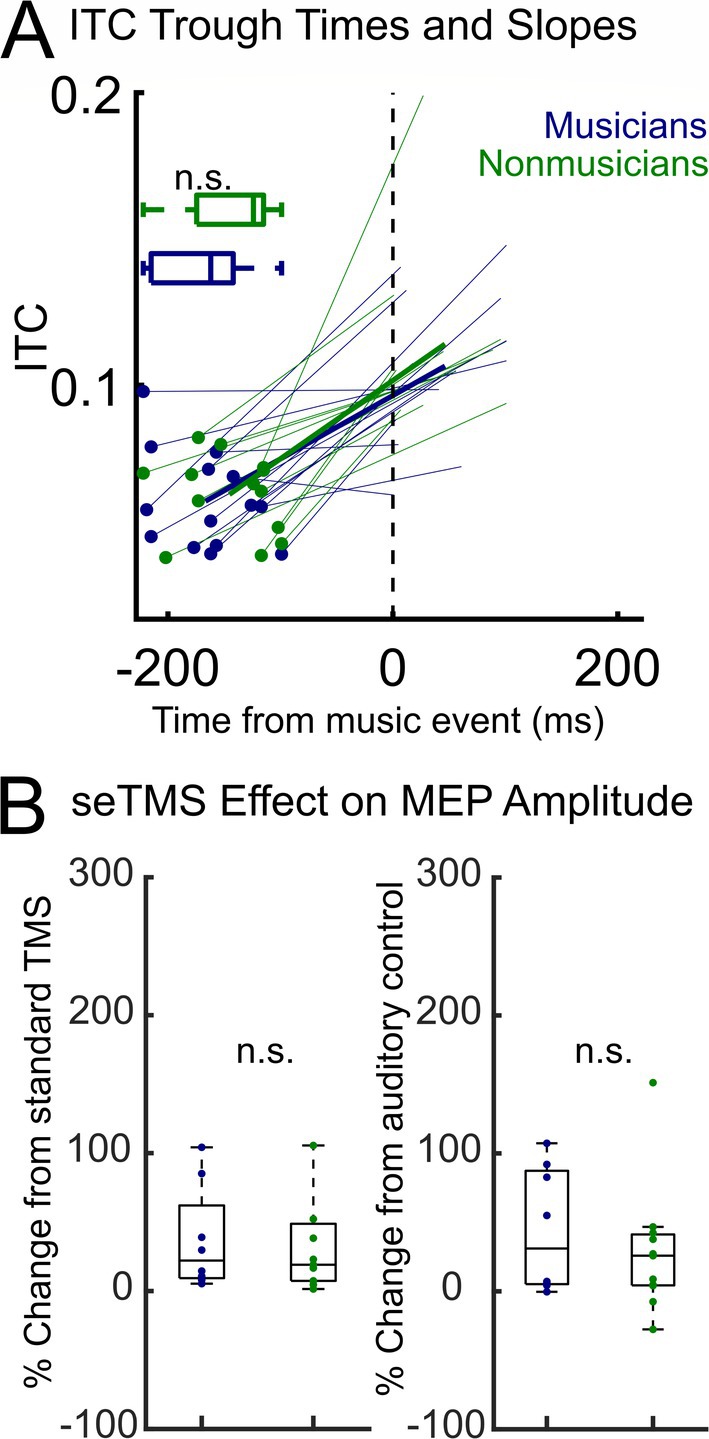
Transcranial magnetic stimulation (TMS) applied to the motor cortex has revolutionized the study of motor physiology in humans. Despite this, TMS-evoked electrophysiological responses show significant fluctuation, due in part to inconsistencies between TMS pulse timing and ongoing brain oscillations. Small or inconsistent responses to TMS limit mechanistic insights and clinical efficacy, necessitating the development of methods to precisely coordinate the timing of TMS pulses to the phase of relevant oscillatory activity. We introduce Sensory Entrained TMS (seTMS), a novel approach that uses musical rhythms to synchronize brain oscillations and time TMS pulses to enhance cortical excitability. Focusing on the sensorimotor alpha rhythm, a neural oscillation associated with motor cortical inhibition, we examine whether rhythm-evoked sensorimotor alpha phase alignment affects primary motor cortical (M1) excitability in healthy young adults (n = 33). We first confirmed using electroencephalography (EEG) that passive listening to musical rhythms desynchronizes inhibitory sensorimotor brain rhythms (mu oscillations) around 200 ms before auditory rhythmic events (27 participants). We then targeted this optimal time window by delivering single TMS pulses over M1 200 ms before rhythmic auditory events while recording motor-evoked potentials (MEPs; 19 participants), which resulted in significantly larger MEPs compared to standard single pulse TMS and an auditory control condition. Neither EEG measures during passive listening nor seTMS-induced MEP enhancement showed dependence on musical experience or training. These findings demonstrate that seTMS effectively enhances corticomotor excitability and establishes a practical, cost-effective method for optimizing non-invasive brain stimulation outcomes.
Keywords: electroencephalogram (EEG); motor evoked potential (MEP); non‐invasive brain stimulation (NIBS); transcranial magnetic stimulation (TMS).
© 2025 The Author(s). Human Brain Mapping published by Wiley Periodicals LLC.
Conflict of interest statement
J.M.R. and C.J.K. are listed as inventors on United States Patent No. US‐20240285964‐A1 (Keller and Ross 2024). C.J.K. holds equity in Alto Neuroscience Inc. A.P.‐L. serves as a paid member of the scientific advisory boards for Neuroelectrics, Magstim Inc., TetraNeuron, Skin2Neuron, MedRhythms, and AscenZion. He is co‐founder of TI solutions and co‐founder and chief medical officer of Linus Health. A.P.‐L. is listed as an inventor on several issued and pending patents on the real‐time integration of transcranial magnetic stimulation with electroencephalography and magnetic resonance imaging, and applications of noninvasive brain stimulation in various neurological disorders; as well as digital biomarkers of cognition and digital assessments for early diagnosis of dementia. No other conflicts of interest, financial or otherwise, are declared by the authors.
Figures


Update of
-
Sensory Entrained TMS (seTMS) enhances motor cortex excitability.bioRxiv [Preprint]. 2024 Nov 27:2024.11.26.625537. doi: 10.1101/2024.11.26.625537. bioRxiv. 2024. Update in: Hum Brain Mapp. 2025 Jul;46(10):e70267. doi: 10.1002/hbm.70267. PMID: 39651225 Free PMC article. Updated. Preprint.
-
Sensory Entrained TMS (seTMS) enhances motor cortex plasticity.bioRxiv [Preprint]. 2025 Jul 27:2025.07.23.666433. doi: 10.1101/2025.07.23.666433. bioRxiv. 2025. Update in: Hum Brain Mapp. 2025 Jul;46(10):e70267. doi: 10.1002/hbm.70267. PMID: 40777444 Free PMC article. Updated. Preprint.
Similar articles
-
Sensory Entrained TMS (seTMS) enhances motor cortex excitability.bioRxiv [Preprint]. 2024 Nov 27:2024.11.26.625537. doi: 10.1101/2024.11.26.625537. bioRxiv. 2024. Update in: Hum Brain Mapp. 2025 Jul;46(10):e70267. doi: 10.1002/hbm.70267. PMID: 39651225 Free PMC article. Updated. Preprint.
-
Phase-dependent local brain states determine the impact of image-guided transcranial magnetic stimulation on motor network electroencephalographic synchronization.J Physiol. 2022 Mar;600(6):1455-1471. doi: 10.1113/JP282393. Epub 2022 Feb 9. J Physiol. 2022. PMID: 34799873 Free PMC article.
-
Assessing cortical excitability with electroencephalography: A pilot study with EEG-iTBS.Brain Stimul. 2024 Mar-Apr;17(2):176-183. doi: 10.1016/j.brs.2024.01.004. Epub 2024 Jan 27. Brain Stimul. 2024. PMID: 38286400
-
The number of stimuli required to reliably assess corticomotor excitability and primary motor cortical representations using transcranial magnetic stimulation (TMS): a systematic review and meta-analysis.Syst Rev. 2017 Mar 6;6(1):48. doi: 10.1186/s13643-017-0440-8. Syst Rev. 2017. PMID: 28264713 Free PMC article.
-
Effects of transcranial magnetic stimulation in modulating cortical excitability in patients with stroke: a systematic review and meta-analysis.J Neuroeng Rehabil. 2022 Feb 22;19(1):24. doi: 10.1186/s12984-022-00999-4. J Neuroeng Rehabil. 2022. PMID: 35193624 Free PMC article.
Cited by
-
Sensory Entrained TMS (seTMS) enhances motor cortex plasticity.bioRxiv [Preprint]. 2025 Jul 27:2025.07.23.666433. doi: 10.1101/2025.07.23.666433. bioRxiv. 2025. Update in: Hum Brain Mapp. 2025 Jul;46(10):e70267. doi: 10.1002/hbm.70267. PMID: 40777444 Free PMC article. Updated. Preprint.
References
-
- Cabral‐Calderin, Y. , Van Hinsberg D., Tielscher A., and Henry M. J.. 2023. “Modulation of Behavioral Auditory Entrainment by tACS Depends on the Stimulation Phase Lag and Electric Field Properties.” Brain Stimulation 16, no. 1: 234.
MeSH terms
Grants and funding
- R01MH126639/MH/NIMH NIH HHS/United States
- Finnish Medical Foundation
- R01 MH126639/MH/NIMH NIH HHS/United States
- Wu Tsai Neurosciences Institute, Stanford University
- Department of Veterans Affairs Sierra-Pacific Data Science Fellowship
- Emil Aaltonen Foundation
- Jack Satter Foundation
- Department of Veterans Affairs Office of Academic Affiliations Advanced Fellowship Program in Mental Illness Research and Treatment
- Orion Research Foundation
- R01 AG076708/AG/NIA NIH HHS/United States
- Burroughs Wellcome Fund
- Medical Research Service of the Veterans Affairs Palo Alto Health Care System
- BrightFocus Foundation
- R01AG076708/NH/NIH HHS/United States
LinkOut - more resources
Full Text Sources
Research Materials
