. 2025 Oct 3;148(10):3505-3513.
doi: 10.1093/brain/awaf208.

Remyelination of chronic demyelinated lesions with directly induced neural stem cells

Affiliations

Remyelination of chronic demyelinated lesions with directly induced neural stem cells

Luca Peruzzotti-Jametti et al. Brain. .

Erratum in

Abstract

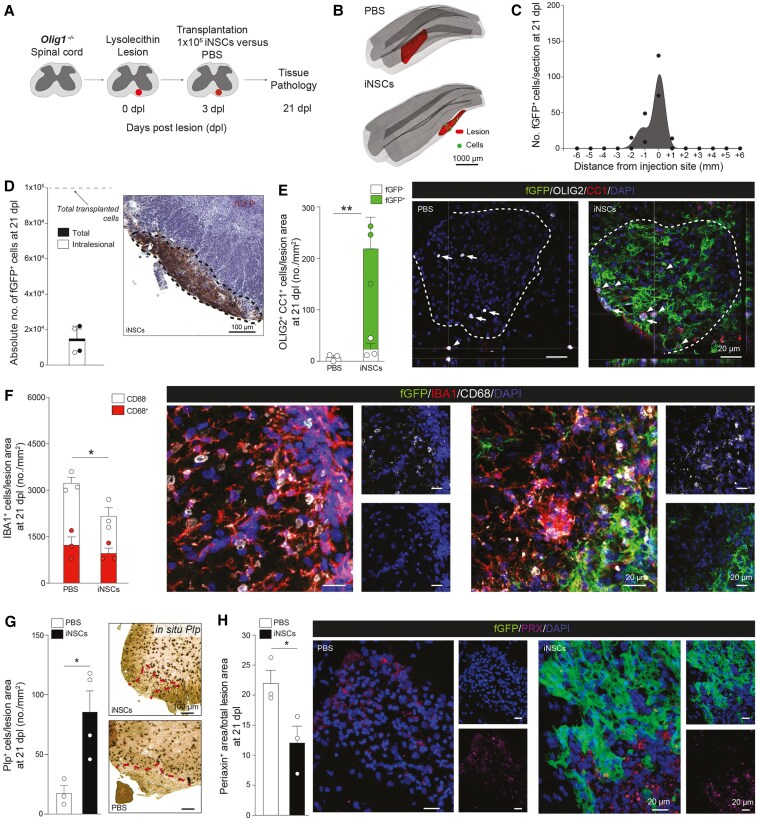
The limited ability of CNS progenitor cells to differentiate into oligodendrocytes limits the repair of demyelinating lesions and contributes to the disability of people with progressive multiple sclerosis (PMS). Neural stem cell (NSC) transplantation has emerged as a safe therapeutic approach in people with PMS, where it holds the promise of healing the injured CNS. However, the mechanisms by which NSC grafts could promote CNS remyelination need to be carefully assessed before their widespread clinical adoption. In this study, we used directly induced NSCs (iNSCs) as a novel transplantation source to boost remyelination in the CNS. Using a mouse model of focal lysophosphatidylcholine (LPC)-induced demyelination, we found that mouse iNSCs promote remyelination by enhancing endogenous oligodendrocyte progenitor cells differentiation and by directly differentiating into mature oligodendrocytes. Transplantation of mouse iNSCs in LPC-lesioned Olig1-/- mice, which exhibits impaired remyelination, confirmed the direct remyelinating ability of grafts and the formation of new exogenous myelin sheaths. We also demonstrated that the xenotransplantation of human iNSCs (hiNSCs) is safe in mice, with hiNSCs persisting long-term in demyelinating lesions where they can produce graft-derived human myelin. Our findings support the use of NSC therapies to enhance remyelination in chronic demyelinating disorders, such as PMS.

Keywords: demyelination; iNSC grafts; multiple sclerosis; oligodendrocyte progenitor cells; remyelination; transplantation.


Conflict of interest statement

S.P. is founder, CSO and shareholder (>5%) of CITC Ltd. The other authors report no competing interests.

Figures

Figure 1
Figure 1
Transplanted mouse NSCs and induced NSCs survive, integrate and differentiate into fully mature oligodendrocytes in LPC spinal cord lesions of wild-type C57BL/6 mice. (A) Experimental setup for LPC-induced lesions and transplantation of mouse NSCs and iNSCs in wild-type (WT) C57BL/6 mice. (B) Representative 3D reconstructions showing individual transplanted fGFP+ cells (green shaded areas) in relation to the LPC-induced lesions of the ventral white matter of the spinal cord (blue shaded areas). (C and D) Stereology-based quantification of cell survival showing the distribution of fGFP+ iNSCs and fGFP+ NSCs (C) and absolute numbers of cells (total number and intralesional) with representative images (D). Data are mean values ± SEM analysed in n = 3 mice/group. (E) Quantification and representative images of endogenous (fGFP) and exogenous (fGFP+) OLIG2+/CC1+ mature oligodendrocytes found in LPC-induced lesions of PBS-, iNSC- and NSC-treated mice. Data are mean values ± SEM analysed in n = 3 mice/group/time point. **P ≤ 0.01, ***P ≤ 0.001, ****P ≤ 0.0001; $$$P ≤ 0.001, $$$$P ≤ 0.0001 versus PBS at 21 dpl; +++P ≤ 0.001 versus GFP iNSC at 10 dpl; ##P ≤ 0.01 versus GFP NSC at 10 dpl. Two-way ANOVA, Tukey's multiple comparisons test. (F) Quantification and representative images of IBA1+ myeloid response and relative CD68 expression found in LPC-induced lesions of PBS-, iNSC- and NSC-treated mice. Data are mean values ± SEM analysed in n = 4, n = 3 and n = 3 mice, respectively. **P ≤ 0.01, ****P ≤ 0.0001; $$P ≤ 0.05, $$$P ≤ 0.001, $$$$P ≤ 0.0001 comparing IBA1+/CD68+ between 21 dpl versus 10 dpl in the same group; ##P ≤ 0.01 versus PBS IBA1+/CD68+ at 21 dpl. Two-way ANOVA, Tukey's multiple comparisons test. (G) Quantification and representative images of in situ hybridization for Plp from PBS-, iNSC- and NSC-treated mice. Data are mean values ± SEM analysed in n = 4, n = 3 and n = 3 mice, respectively. *P ≤ 0.05, **P ≤ 0.01. One-way ANOVA, Holm-Šídák's multiple comparison test. (H) Quantification and representative images of PRX+ area of PBS-, iNSC- and NSC-treated mice showing stem cell contribution to remyelinating the LPC-induced spinal cord lesions. Data are mean area/total lesion area ± SEM analysed in n = 4, n = 3, n = 3 mice, respectively. *P ≤ 0.05. One-way ANOVA, Holm-Šídák's multiple comparison test. dpl = days post lesion; iNSC = induced neural stem cell; LPC = lysophosphatidylcholine; NSC = neural stem cell; SEM = standard error of the mean.
Figure 2
Figure 2
Transplanted mouse induced neural stem cells survive, integrate and generate mature oligodendrocytes in LPC spinal cord lesions of Olig1−/− mice. (A) Experimental setup for LPC-induced lesions and transplantation of mouse iNSCs in Olig1−/− mice. (B) Representative 3D reconstructions showing individual transplanted fGFP+ iNSCs (green shaded areas) in relation to the LPC-induced lesions of the ventral white matter of the spinal cord (red shaded areas). (C and D) Stereology-based quantification of cell survival showing the distribution of fGFP+ iNSCs (C) and absolute numbers of cells (total number and intralesional) with representative images (D). Data are mean values ± SEM analysed in n = 2 mice. (E) Quantification and representative images of endogenous (fGFP) and exogenous (fGFP+) OLIG2+/CC1+ mature oligodendrocytes found in LPC-induced lesions of PBS- and iNSC-treated Olig1−/− mice at 21 dpl. Data are mean values ± SEM analysed in n = 3 mice/group. **P ≤ 0.01. Unpaired t-test. (F) Quantification and representative images of IBA1+ myeloid response and relative CD68 expression found in LPC-induced lesions of PBS- and iNSC-treated Olig1−/− mice at 21 dpl. Data are mean values ± SEM analysed in n = 3 mice/group. *P ≤ 0.05. Unpaired t-test. (G) Quantification and representative images of in situ hybridization for Plp from PBS- and iNSC-treated Olig1−/− mice at 21 dpl. Data are mean values ± SEM analysed in n = 3, n = 4 mice, respectively. *P ≤ 0.05. Unpaired t-test. (H) Quantification and representative images of PRX+ area of PBS- and iNSC-treated Olig1−/− mice showing stem cell contribution to remyelinating LPC-induced spinal cord lesions at 21 dpl. Data are mean area/total lesion area ± SEM analysed in n =3 mice/group. *P ≤ 0.05. Unpaired t-test. dpl = days post lesion; iNSC = induced neural stem cell; LPC = lysophosphatidylcholine;SEM = standard error of the mean.
Figure 3
Figure 3
Transplanted mouse induced neural stem cells remyelinate LPC lesions of Olig1−/− mice. (A) Representative pictures of toluidine blue stained LPC lesions (top) and corresponding TEM images (bottom) of PBS-treated wild-type (WT) mice, PBS-treated Olig1−/− mice and iNSC-treated Olig1−/− mice. Asterisks indicate demyelinated axons, arrowheads indicate remyelinated axons, dashed lines indicate the border of the lesion. (B) Quantification of the total number of axons per lesion area in PBS-treated WT mice (n = 3), PBS-treated Olig1−/− mice (n = 4) and iNSC-treated Olig1−/− mice (n = 3). (C and D) Quantification of the g-ratio of axons within the demyelinated lesion of PBS-treated WT mice, PBS-treated Olig1−/− mice and iNSC-treated Olig1−/− mice. Data are mean ± min max values (C) and single values plotted on axonal diameter (D). ****P ≤ 0.0001. One way ANOVA, Holm-Šídák's multiple comparisons test. (E) Confocal Raman imaging of a representative LPC lesion (from PBS-treated Olig1−/− mouse) at 21 dpl, showing peaks associated with lipids (1445 cm−1), lipid/protein (1665 cm−1) and DNA (1345 cm−1). (F) Mean Raman spectra of lesions in PBS-treated WT (n = 3), PBS-treated Olig1−/− (n = 5) and iNSC-treated Olig1−/− mice (n = 3) at 21 dpl. Peaks associated with myelin/lipids [1302 cm⁻1 τ(CH2), 1445 cm⁻1 α(CH2/CH3) and 1665 cm⁻1 ν(C = C)] or axons/proteins [e.g. 1004 (phenylalanine)] are labelled. (G) Mean difference spectra (±1 standard deviation) of LPC lesions at 21 dpl, comparing the three different groups: PBS-treated WT (n = 3), PBS-treated Olig1−/− (n = 5) and iNSC-treated Olig1−/− (n = 3) mice. PBS-treated WT and iNSC-treated Olig1−/− minus PBS-treated Olig1−/− difference spectra (top two lines) show major differences, while PBS-treated WT and iNSC-treated Olig1−/− difference spectra (bottom line) are superimposable. Red dotted box outlines peaks associated with myelin/lipids. dpl = days post lesion; iNSC = induced neural stem cell; LPC = lysophosphatidylcholine; min = minimum; max = maximum; TEM = transmission electron microscopy.
Figure 4
Figure 4
Transplanted human induced neural stem cells survive, integrate and differentiate in mature oligodendrocytes in LPC spinal cord lesions of Olig1−/− mice. (A) Experimental setup for LPC-induced lesions and transplantation of hiNSCs in Olig1−/− mice. (B) Representative 3D reconstructions showing individual transplanted fGFP+ hiNSCs (green shaded areas) in relation to the LPC-induced lesions of the ventral white matter of the spinal cord (red shaded areas). (C and D) Stereology-based quantification of cell survival showing distribution of fGFP+ hiNSCs (C) with absolute numbers of cells (total number and intralesional) (D). Data are mean values ± SEM analysed in n = 4 mice at 1.5 mpt and n = 4 mice at 6 mpt. (E) Quantification and representative images of endogenous (fGFP) and exogenous (fGFP+) OLIG2+/CC1+ mature oligodendrocytes found in LPC-induced lesions of PBS- and hiNSC-treated mice. Data are mean values ± SEM analysed in n = 4 mouse/group/time point. (F) Representative images of immunofluorescence stainings for MBP (myelin marker) and fGFP+ within lesions (maximum projections are shown on the left). Right: Respective qualitative histograms of the lesions (top) and single z-stack of the inset shown in the maximum projection with added NFL staining for axons (bottom). (G) Representative TEM images of LPC lesions from PBS-treated Olig1−/− and hiNSC-treated Olig1−/− mice at 6 mpt. Asterisks indicate demyelinated axons, arrowheads indicate remyelinated axons. (H) Quantification of the total number of axons per lesion area in PBS-treated Olig1−/− mice (n = 2) and hiNSC-treated Olig1−/− mice (n = 3). (I) Quantification of the g-ratio of axons within the demyelinated lesion of PBS-treated Olig1−/− mice (n = 2) and hiNSC-treated Olig1−/− mice (n = 3). Data are single values plotted on axonal diameter. (J) Representative TEM image showing fGFP+ hiNSCs (pseudocoloured in green) wrapping around an axon within LPC lesions. Arrows show immunogold labelling for fGFP. hiNSC = human induced neural stem cell; LPC = lysophosphatidylcholine; mpt = months post transplantation; SEM = standard error of the mean; TEM = transmission electron microscopy; WT = wild-type.

References

    1. Reich DS, Lucchinetti CF, Calabresi PA. Multiple sclerosis. N Engl J Med. 2018;378:169–180. - PMC - PubMed
    1. Graves JS, Krysko KM, Hua LH, Absinta M, Franklin RJM, Segal BM. Ageing and multiple sclerosis. Lancet Neurol. 2023;22:66–77. - PubMed
    1. Franklin RJM. Why does remyelination fail in multiple sclerosis? Nat Rev Neurosci. 2002;3:705–714. - PubMed
    1. Leone MA, Gelati M, Profico DC, et al. Phase I clinical trial of intracerebroventricular transplantation of allogeneic neural stem cells in people with progressive multiple sclerosis. Cell Stem Cell. 2023;30:1597–1609.e8. - PubMed
    1. Genchi A, Brambilla E, Sangalli F, et al. Neural stem cell transplantation in patients with progressive multiple sclerosis: An open-label, phase 1 study. Nat Med. 2023;29:75–85. - PMC - PubMed

Substances