. 2025 Sep;116(9):2457-2470.
doi: 10.1111/cas.70129. Epub 2025 Jul 7.

Antitumor Activity of Tumor-Infiltrating Neutrophils Revealed by a Syngeneic Mouse Model of Cholangiocarcinoma

Affiliations

Antitumor Activity of Tumor-Infiltrating Neutrophils Revealed by a Syngeneic Mouse Model of Cholangiocarcinoma

Osamu Sugahara et al. Cancer Sci. 2025 Sep.

Abstract

The tumor immune microenvironment plays a key role in the regulation of cancer progression. Recent studies have suggested a relation between diverse tumor genotypes and tumor immune microenvironment phenotypes for cholangiocarcinoma (CCA). However, the contribution of tumor-infiltrating immune cells to CCA progression has remained unclear, underscoring the need for genetically defined CCA models in immunocompetent mice. We here aimed to generate genetically engineered and transplantable CCA organoids from C57BL/6 mice and to investigate the role of tumor-infiltrating immune cells in CCA progression with this model. CCA organoids were generated ex vivo with the use of the CRISPR/Cas9 system. Orthotopic transplantation of CCA organoids harboring mutations in Smad4, Trp53, and Kras into wild-type C57BL/6 mice resulted in tumor formation accompanied by distant metastasis. Selective depletion of immune cell types in the tumor-bearing mice revealed an antitumor action of tumor-infiltrating neutrophils (TINs) that was mediated by direct killing of cancer cells through the production of reactive oxygen species. Furthermore, administration of recombinant human granulocyte colony-stimulating factor (rhG-CSF) increased the number and cytotoxicity of TINs, suppressed tumor growth, and prolonged the survival of tumor-bearing mice. Finally, combination treatment with rhG-CSF and standard chemotherapy resulted in a synergistic attenuation of tumor growth. Our study therefore provides a syngeneic and genetically defined mouse model of CCA and highlights the therapeutic potential of targeting TINs with rhG-CSF.

Keywords: cholangiocarcinoma; granulocyte colony‐stimulating factor (G‐CSF); neutrophil; organoid; tumor microenvironment.


Conflict of interest statement

Keiichi I. Nakayama is an editorial board member of Cancer Science and receives annual profit from shares from AntiCancer Technologies Inc. and Q‐Innovation Inc. Other authors do not have COI.

Figures

FIGURE 1
FIGURE 1
Ex vivo generation of CCA organoids. (A) Schematic representation for the establishment of normal liver organoids and the sequential introduction of Smad4 (S), Trp53 (P), and Kras (K) mutations by genome editing with the CRISPR/Cas9 system. KO, knockout; KI, knock‐in; GFs, growth factors. (B–E) Growth of normal and genetically engineered liver organoids under the genotype‐selective conditions indicated in (A). Scale bars, 1 mm. (F) Sanger sequencing of the Smad4 locus for liver organoids (S‐organoids) grown in medium containing TGF‐β1. (G) Sanger sequencing of the Trp53 locus for liver organoids (SP‐organoids) grown in medium containing Nutlin‐3. (H) Strategy for modification of the Kras locus. A donor vector harboring the G12D mutation of Kras (red) and a synonymous mutation in the PAM sequence (green) was introduced into SP‐organoids together with the Cas9/sgRNA vector. Successful knock‐in was confirmed by Sanger sequencing analysis of SPK‐organoids after culture in the selection medium.
FIGURE 2
FIGURE 2
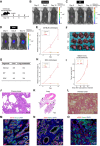
CRISPR/Cas9‐engineered CCA organoids are tumorigenic and metastatic in C57BL/6 mice. (A) Schematic representation of tumorigenicity assays performed for normal, SP‐, and SPK‐organoids. Organoids expressing retrovirally transduced Venus‐Akaluc protein were orthotopically transplanted in C57BL/6 mice on day −10 and analyzed on days 0, 6, and 12. (B–D) Representative Akaluc bioluminescence (AkaBLI) images of orthotopically transplanted normal (B), SP‐ (C), or SPK‐ (D) organoids in C57BL/6 mice on days 0, 6, and 12. Radiance units are photons per second per square centimeter per steradian (p/s/cm2/sr). (E) Quantification of bioluminescence of normal, SP‐, and SPK‐organoids transplanted into the liver of C57BL/6 mice. Data are means ± SEM (n = 4 mice per group). (F) Gross appearance of the liver at 22 days after transplantation of normal, SP‐, or SPK‐organoids. Scale bar, 10 mm. (G) Summary of the incidence of liver tumors and lung metastases in C57BL/6 mice with orthotopically transplanted liver organoids. (H) Quantification of bioluminescence of normal, SP‐, and SPK‐organoids (n = 3, 4, and 3, respectively) transplanted into the liver of NSG mice. Data are means ± SEM. (I) Quantification of tumor volume for SP‐ and SPK‐organoids injected s.c. into Balb/c‐nu/nu mice. Data are means ± SEM (n = 5 mice per group). (J,K) Representative hematoxylin–eosin staining of the liver tumor (J) and lung metastases (K) that developed from SPK‐organoids in a C57BL/6 mouse. Arrows indicate lung metastases. Scale bars, 500 μm (J) or 1 mm (K). (L) Staining of a liver tumor derived from SPK‐organoids with picro‐Sirius red. Scale bar, 100 μm. (M–O) Immunohistofluorescence staining of liver tumors derived from SPK‐organoids expressing Venus‐Akaluc with antibodies to Krt19 (M), to Sox9 (N), and to αSMA (O). Nuclei were stained with 4′,6‐diamidino‐2‐phenylindole (DAPI). Scale bars, 50 μm.
FIGURE 3
FIGURE 3
Orthotopically transplanted organoids recapitulate the inflammatory features of human CCA. (A) Schematic representation for analysis of the cellular composition of liver tumors. SPK‐organoids expressing retrovirally transduced Venus‐Akaluc protein were orthotopically transplanted into C57BL/6 mice on day −10 and analyzed on day 0. (B) Flow cytometric quantification of the percentage of CD45+ leukocytes in sham‐operated liver, tumor‐adjacent liver tissue, and SPK‐organoid–derived tumors. Data are means ± SEM (n = 4 mice per group). (C, L) Representative immunofluorescence staining of CD45 (C) and Ly6G (L) in tumor‐adjacent liver and tumor tissue. Nuclei were stained with DAPI. Scale bars, 50 μm. (D, F, H, J) Representative flow cytometry plots for Tregs (D), M2 macrophages (F), neutrophils (H), and CD8+ T cells (J) in tumor‐adjacent liver and tumor tissue. SSC, side scatter. (E, G, I, K) Flow cytometric quantification of Tregs (E), M2 macrophages (G), neutrophils (I), and CD8+ T cells (K) in sham‐operated liver, tumor‐adjacent liver tissue, and tumors. Data are means ± SEM (n = 4 to 13 mice per group). *p < 0.05, **p < 0.01, ***p < 0.001; n.s., not significant (Tukey–Kramer test).
FIGURE 4
FIGURE 4
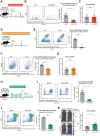
Selective depletion of tumor‐infiltrating immune cells reveals an antitumor action of neutrophils. (A–C) WT C57BL/6 mice were orthotopically transplanted with Venus‐Akaluc–expressing SPK‐organoids on day −10 and treated with control IgG1 or antibodies to CD25 on days 0, 6, and 12 (A). Representative flow cytometry plots and quantification of intratumoral Tregs on day 15 for tumor‐bearing mice treated with control IgG1 (n = 4) or anti‐CD25 (n = 4) (B). Relative bioluminescence of liver tumors on day 12 for mice treated with control IgG1 (n = 5) or anti‐CD25 (n = 4) (C). (D–G) Venus‐Akaluc–expressing SPK‐organoids were orthotopically transplanted in WT or Ccr2 mice (D). Representative flow cytometry plots and quantification of monocytes isolated from tumors of WT (n = 4) or Ccr2 (n = 3) mice on day 24 (E). Representative flow cytometry plots and quantification of M2 macrophages isolated from tumors of WT (n = 4) or Ccr2 (n = 3) mice on day 24 (F). Relative bioluminescence of liver tumors on day 24 in WT (n = 7) and Ccr2 (n = 7) mice (G). (H–K) WT C57BL/6 mice were orthotopically transplanted with Venus‐Akaluc–expressing SPK‐organoids and treated with antibodies to rat Igκ light chain and either control IgG2a or antibodies to Ly6G. Control IgG2a and anti‐Ly6G were administered daily, whereas anti‐rat Igκ light chain was administered every 2 days (H). Representative flow cytometry plots and quantification of circulating neutrophils on day 6 for tumor‐bearing mice treated with control IgG2a (n = 4) or anti‐Ly6G (n = 4) (I). Representative flow cytometry plots and quantification of TINs on day 14 for tumor‐bearing mice treated with control IgG2a (n = 4) or anti‐Ly6G (n = 4) (J). Relative bioluminescence of liver tumors on day 12 in mice treated with control IgG2a (n = 16) or anti‐Ly6G (n = 16) (K). Quantitative data in bar graphs are means ± SEM. *p < 0.05, **p < 0.01, ***p < 0.001; n.s., not significant (Welch's t test).
FIGURE 5
FIGURE 5
Cytotoxicity of TINs for CCA is mediated by ROS. (A) Experimental protocol for assessment of neutrophil cytotoxicity. TINs were isolated by FACS from tumors formed by SPK‐organoids in C57BL/6 mice and were cultured with preseeded Venus‐Akaluc‐expressing SPK‐cancer cells in adherent culture. (B) Quantification of cytotoxicity as in (A) with a fixed number of cancer cells and various numbers of TINs. Data are presented as box‐and‐whisker plots, with the boxes indicating quartile values and the whiskers denoting the range of the data, excluding outliers (n = 4 independent experiments). (C) Production of ROS by the NADPH oxidase complex. SOD converts superoxide to H2O2, catalase catalyzes the degradation of H2O2 to H2O and O2, and taurine eliminates HOCl. (D) Quantification of TIN cytotoxicity as in (A) in the absence or presence of catalase, SOD, or taurine (n = 4 independent experiments). *p < 0.05, **p < 0.01, ***p < 0.001; n.s., not significant by Dunnett's test (B) or Welch's t test (D).
FIGURE 6
FIGURE 6
Therapeutic effect of rhG‐CSF administration in CCA‐bearing mice. (A) Overall survival curves for CCA patients in the E‐MTAB‐6389 data set with high (n = 56) or low (n = 20) levels of CSF3 expression. (B) G‐CSF‐deficient mice were generated by introduction of an 8‐bp deletion in exon 2 of both alleles of the Csf3 gene. (C) Flow cytometric quantification of peripheral blood neutrophils in WT and G‐CSF knockout (KO) mice. Data are means ± SEM (n = 8 mice per group). (D–G) SPK‐organoids were orthotopically transplanted in WT mice or G‐CSF KO mice on day −10, and the mice were analyzed on day 12 (D). Flow cytometric quantification of TINs on day 12 in WT (n = 4) and G‐CSF KO (n = 4) mice; data are means ± SEM (E). Gross appearance of liver tumors and quantification of tumor weight on day 12 in WT (n = 7) and G‐CSF KO (n = 4) mice; data are means ± SEM (F). Survival curves for WT (n = 9) and G‐CSF KO (n = 9) mice with orthotopically transplanted SPK‐organoids (G). (H–K) WT C57BL/6 mice were orthotopically transplanted with SPK‐organoids on day −10 and were injected s.c. with rhG‐CSF or phosphate‐buffered saline (PBS) daily for 15 days beginning on day 0 (H). Representative flow cytometry plots and quantification of TINs on day 15 in tumor‐bearing mice treated with PBS (n = 9) or rhG‐CSF (n = 9); data are means ± SEM (I). Gross appearance of liver tumors and quantification of tumor weight on day 15 in mice treated with PBS (n = 9) or rhG‐CSF (n = 9); data are means ± SEM (J). Survival curves for tumor‐bearing mice treated with PBS (n = 16) or rhG‐CSF (n = 16) (K). *p < 0.05 by the log‐rank test (A, G, K) or Welch's t test (C, E, F, I, J).
FIGURE 7
FIGURE 7
Administration of rhG‐CSF enhances the cytotoxicity of TINs for CCA. (A) t‐SNE projection of scRNA‐seq data for TINs isolated from liver tumors formed by SPK‐organoids in C57BL/6 mice and treated with PBS (n = 2) or rhG‐CSF (n = 2) as in Figure 6H. (B) Heat map for CytoTRACE scores of the scRNA‐seq data overlaid on the t‐SNE map (left) and box plots showing CytoTRACE values for each treatment (right). Diff., differentiated. (C) Volcano plot showing differentially expressed genes (DEGs) for TINs from rhG‐CSF‐treated mice compared with those from control mice. (D) GO analysis of DEGs upregulated (fold change of > 1.5 and adjusted p value of < 0.05) for TINs from mice treated with rhG‐CSF in (C). The top 10 terms for biological processes are shown. (E) Quantification of cytotoxicity toward adherent SPK‐cells for TINs isolated from mice treated with PBS or rhG‐CSF (n = 4 or 5 independent experiments, respectively). (F–H) WT C57BL/6 mice were orthotopically transplanted with SPK‐organoids and treated with gemcitabine (GEM), cisplatin (CDDP), and rhG‐CSF. GEM and CDDP were administered i.p. on days 0 and 7, and rhG‐CSF was administered s.c. on days 3, 4, 10, and 11 (F). Quantitation of TINs on day 13 for tumor‐bearing mice treated with chemotherapy or rhG‐CSF as indicated (n = 3 mice per group) (G). Quantification of tumor weight on day 13 for mice treated with chemotherapy or rhG‐CSF as indicated (n = 15 to 16 mice per group) (H). Data in (E), (G), and (H) are means ± SEM. *p < 0.05, **p < 0.01, ***p < 0.001; n.s., not significant by the Steel‐Dwass test (B, H), Welch's t test (E), or the Tukey–Kramer test (G).

References

    1. Banales J. M., Marin J. J. G., Lamarca A., et al., “Cholangiocarcinoma 2020: The Next Horizon in Mechanisms and Management,” Nature Reviews. Gastroenterology & Hepatology 17 (2020): 557–588, 10.1038/s41575-020-0310-z. - DOI - PMC - PubMed
    1. Rumgay H., Arnold M., Ferlay J., et al., “Global Burden of Primary Liver Cancer in 2020 and Predictions to 2040,” Journal of Hepatology 77 (2022): 1598–1606, 10.1016/j.jhep.2022.08.021. - DOI - PMC - PubMed
    1. Kitano Y., Okabe H., Yamashita Y. I., et al., “Tumour‐Infiltrating Inflammatory and Immune Cells in Patients With Extrahepatic Cholangiocarcinoma,” British Journal of Cancer 118 (2018): 171–180, 10.1038/bjc.2017.401. - DOI - PMC - PubMed
    1. Lowery M. A., Ptashkin R., Jordan E., et al., “Comprehensive Molecular Profiling of Intrahepatic and Extrahepatic Cholangiocarcinomas: Potential Targets for Intervention,” Clinical Cancer Research 24 (2018): 4154–4161, 10.1158/1078-0432.CCR-18-0078. - DOI - PMC - PubMed
    1. Lamarca A., Barriuso J., McNamara M. G., and Valle J. W., “Molecular Targeted Therapies: Ready for “Prime Time” in Biliary Tract Cancer,” Journal of Hepatology 73 (2020): 170–185, 10.1016/j.jhep. - DOI - PubMed

MeSH terms

Substances