

Understanding the determinants of treated bed net use in Ethiopia: A machine learning classification approach using PMA Ethiopia 2023 survey data
- PMID: 40622970
- PMCID: PMC12233236
- DOI: 10.1371/journal.pone.0327800
Understanding the determinants of treated bed net use in Ethiopia: A machine learning classification approach using PMA Ethiopia 2023 survey data
Abstract
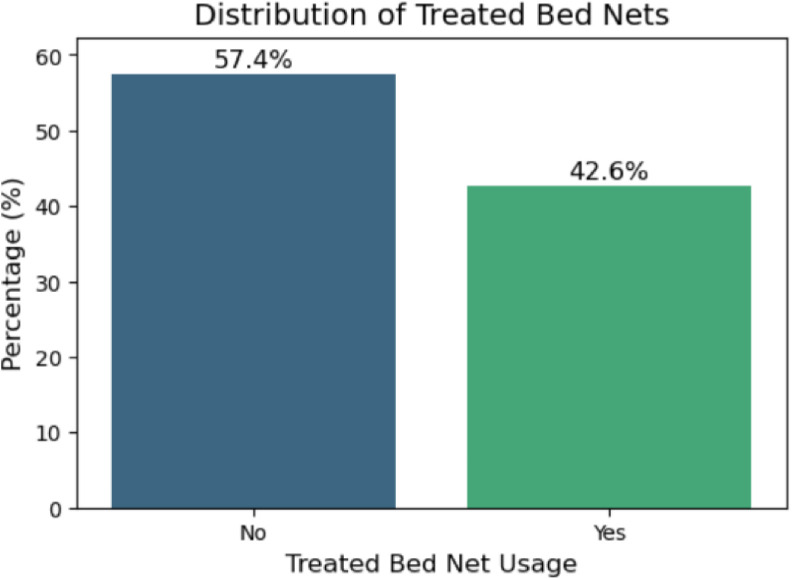
Introduction: Malaria remains a significant public health challenge in Ethiopia, with over 7.3 million cases and 1,157 deaths reported between January 1 and October 20, 2024. Despite extensive distribution campaigns, 35% of insecticide-treated nets (ITNs) remain underutilized, hindering malaria control efforts. Traditional statistical approaches have identified socioeconomic and demographic factors as predictors of ITN use, but often fail to capture complex, nonlinear interactions. This study applies machine learning to identify non-apparent factors of ITN utilization and investigates its performance in prediction as compared to traditional logistic regression.
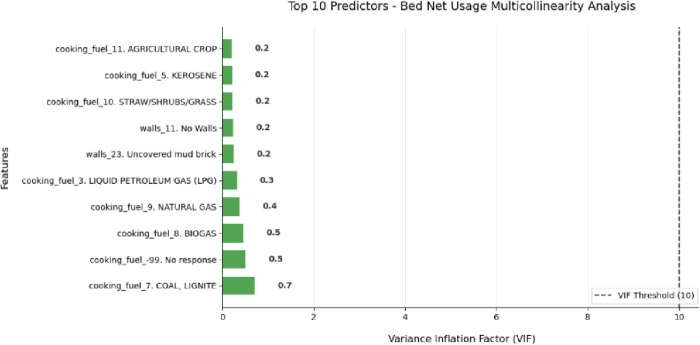
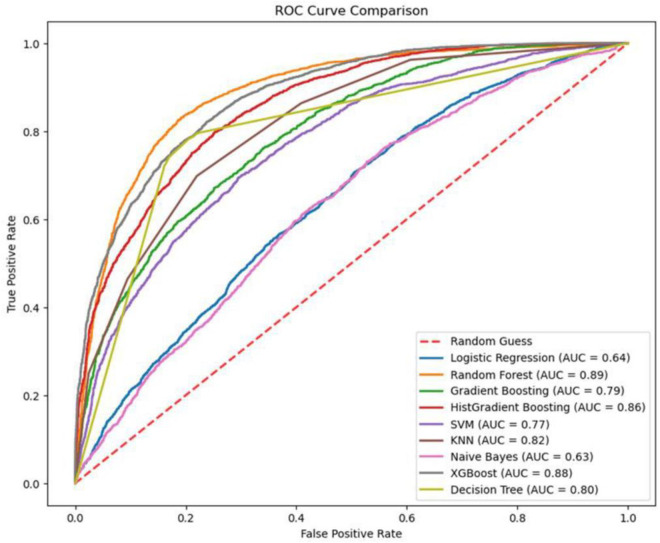
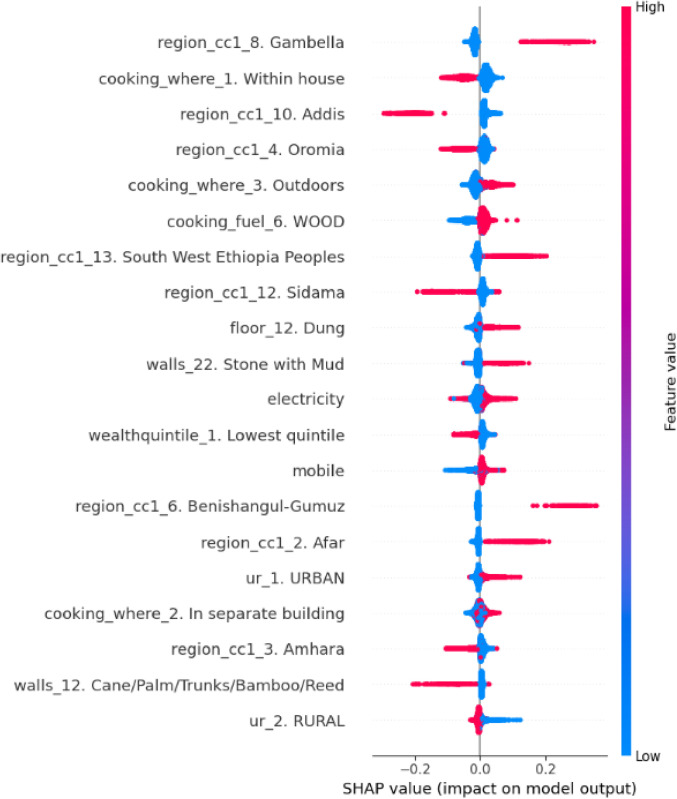
Methods: This study applied ML models, including Random Forest, XGBoost, and Gradient Boosting, to predict ITN utilization using the 2023 Performance Monitoring for Action (PMA) Ethiopia dataset, a nationally representative survey of 9,763 households. The dataset included 18 variables: region, household size, wealth quintile, and housing conditions. Model performance was evaluated using accuracy, precision, recall, F1-score, and AUC-ROC. The values of SHAP (Shapley Additive Explanations) were used to interpret feature importance and interaction effects.
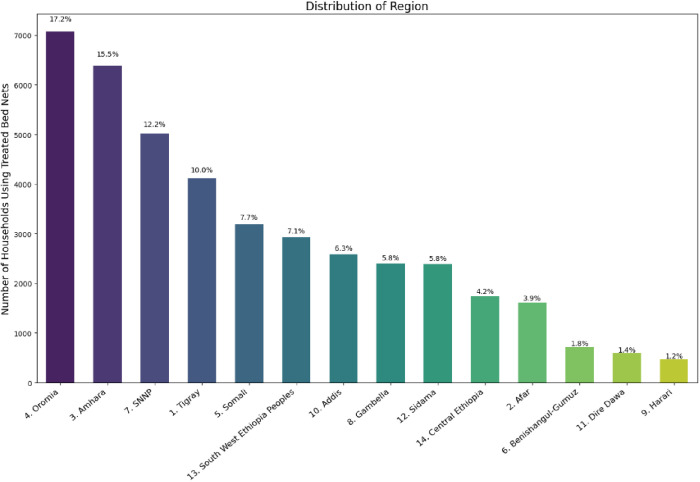
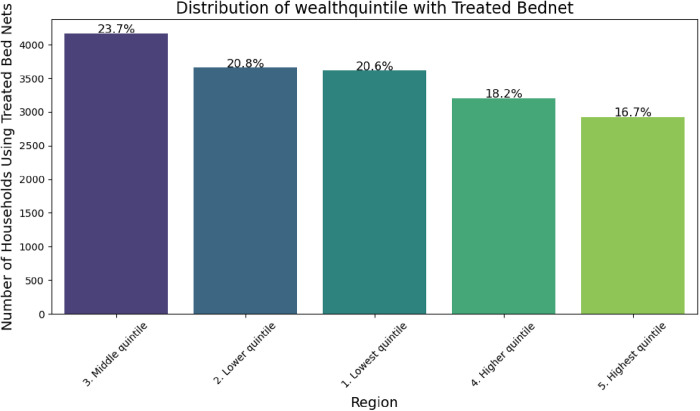
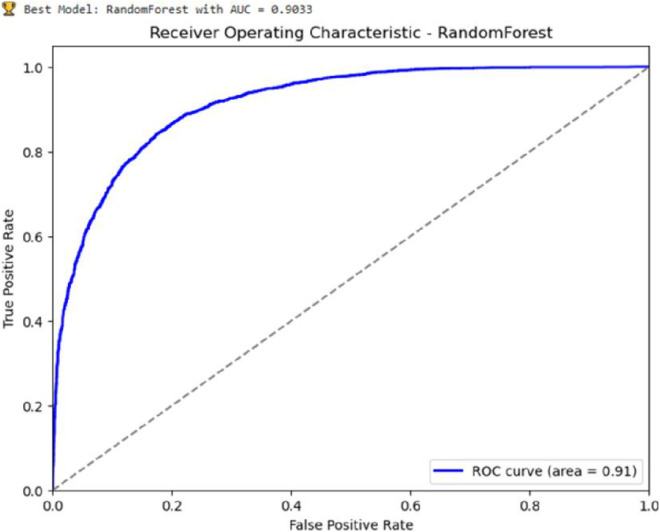
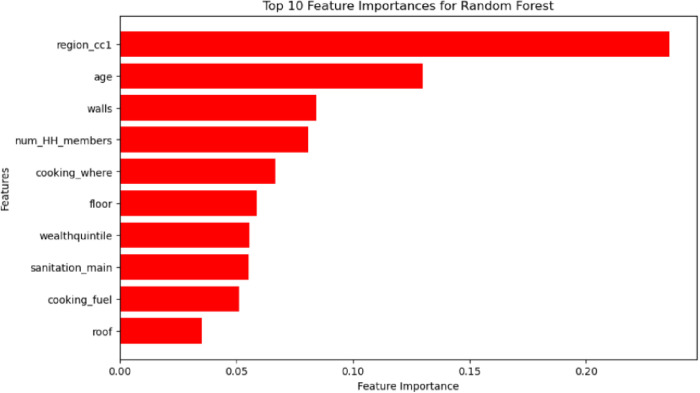
Results: Random Forest and XGBoost outperformed traditional logistic regression, achieving AUC scores of 0.89(0.91 after optimization) and 0.88, respectively. Key determinants of ITN utilization included geographic region, household size, wealth quintile, and maternal education. Nonlinear interactions, such as the moderating effect of maternal education on income-related barriers, were identified. Regional disparities were evident, with Amhara and Oromia showing higher ITN Utilization compared to urban areas like Harari and Dire Dawa. Middle-income households exhibited the highest ITN usage (23.7%), challenging the assumption of linear wealth gradients.
Conclusion: This study demonstrates the superiority of machine learning (ML) models in capturing complex, nonlinear determinants of ITN utilization, providing actionable insights for targeted malaria prevention strategies. Findings underscore the need for region-specific interventions, integration of ITN distribution with educational and economic empowerment programs, and synergies with environmental health improvements. The study highlights the potential of ML to enhance precision in public health in resource-limited settings, contributing to Ethiopia's National Malaria Elimination Roadmap and global malaria eradication efforts.
Copyright: © 2025 Abraham Keffale Mengistu. This is an open access article distributed under the terms of the Creative Commons Attribution License, which permits unrestricted use, distribution, and reproduction in any medium, provided the original author and source are credited.
Conflict of interest statement
The Author has no competing interests
Figures
Similar articles
-
Barriers to effective usage of insecticide-treated mosquito nets (ITNS) among women of reproductive age in Tanzania: a national cross-sectional survey.Malar J. 2025 Jul 17;24(1):234. doi: 10.1186/s12936-025-05417-3. Malar J. 2025. PMID: 40676603 Free PMC article.
-
Indoor residual spraying for preventing malaria in communities using insecticide-treated nets.Cochrane Database Syst Rev. 2022 Jan 17;1(1):CD012688. doi: 10.1002/14651858.CD012688.pub3. Cochrane Database Syst Rev. 2022. PMID: 35038163 Free PMC article.
-
The status of ownership and utilization of long-lasting insecticidal treated nets in war-torn Tigray, Ethiopia.Sci Rep. 2025 Jul 30;15(1):27847. doi: 10.1038/s41598-025-03180-8. Sci Rep. 2025. PMID: 40738901 Free PMC article.
-
An observational study evaluating the epidemiological and entomological impacts of piperonyl butoxide insecticide-treated nets (ITNs) compared to a combination of indoor residual spraying (IRS) plus standard pyrethroid-only ITNs in Amhara Region, Ethiopia, 2019-2023.BMJ Glob Health. 2025 Jan 29;10(1):e016617. doi: 10.1136/bmjgh-2024-016617. BMJ Glob Health. 2025. PMID: 39880414 Free PMC article. Clinical Trial.
-
Insecticide-treated bed net utilization and associated factors among pregnant women in Ethiopia: a systematic review and meta-analysis.Malar J. 2023 Aug 2;22(1):223. doi: 10.1186/s12936-023-04655-7. Malar J. 2023. PMID: 37533029 Free PMC article.
References
-
- Tola DE, Tesfaye AH, Solbana LK, Nagari SL, Bayissa ZB, Chaka EE. Attack rate and determinants of malaria outbreak in Ethiopia: a systematic review and meta-analysis. Clinical Epidemiology and Global Health. 2025;33:102045. doi: 10.1016/j.cegh.2025.102045 - DOI
MeSH terms
LinkOut - more resources
Full Text Sources
Medical
