

Estimating behavioural relaxation induced by COVID-19 vaccines in the first months of their rollout
- PMID: 40623118
- PMCID: PMC12258572
- DOI: 10.1371/journal.pcbi.1013266
Estimating behavioural relaxation induced by COVID-19 vaccines in the first months of their rollout
Abstract
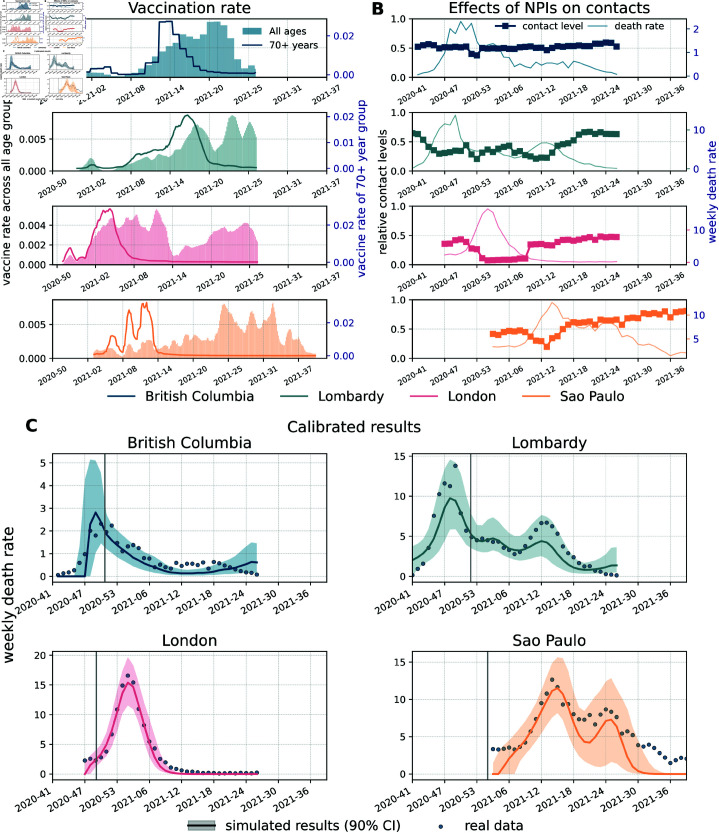
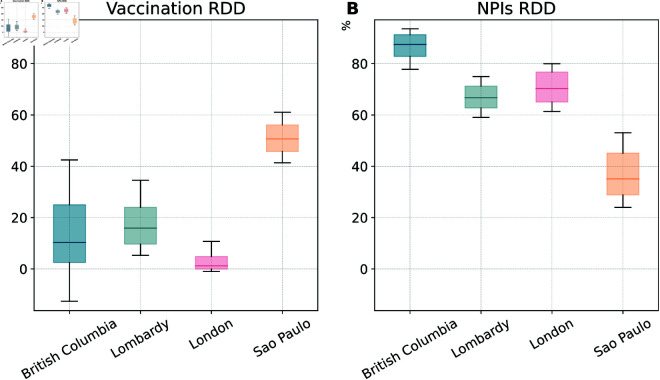
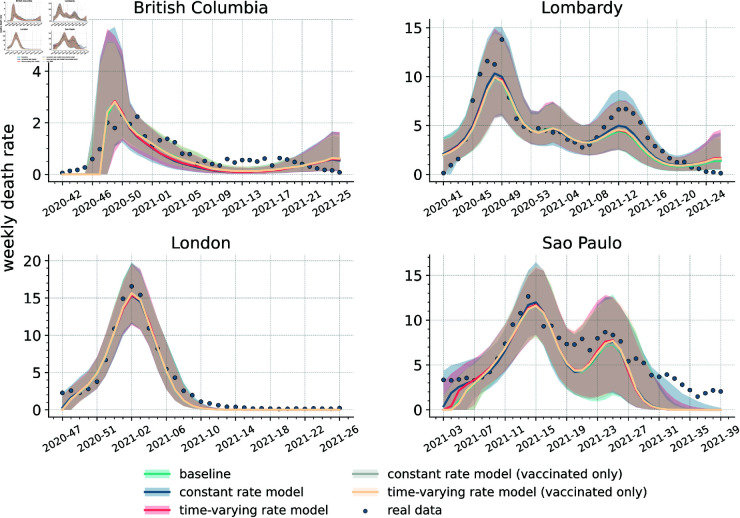
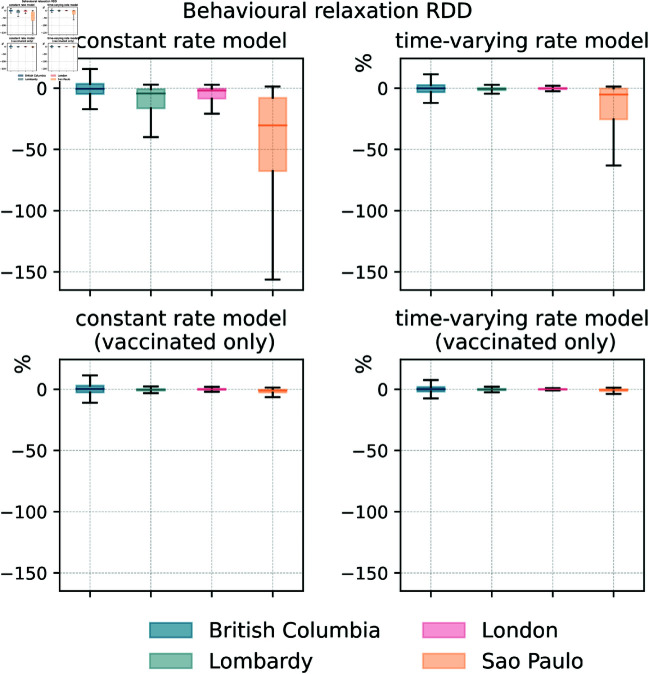
The initial rollout of COVID-19 vaccines has been challenged by logistical issues, limited availability of doses, scarce healthcare capacity, spotty acceptance, and the emergence of variants of concern. Non-pharmaceutical interventions (NPIs) have been critical to support these phases. However, vaccines may have prompted behavioural relaxation, potentially reducing NPIs adherence. Epidemic models have explored this phenomenon, but they have not been validated against data. Moreover, recent surveys provide conflicting results on the matter. The extent of behavioural relaxation induced by COVID-19 vaccines is still unclear. Here, we aim to study this phenomenon in four regions. We implement five realistic epidemic models which include age structure, multiple virus strains, NPIs, and vaccinations. One of the models acts as a baseline, while the others extend it including different behavioural relaxation mechanisms. First, we calibrate the baseline model and run counterfactual scenarios to quantify the impact of vaccinations and NPIs. Our results confirm the critical role of both in reducing infection and mortality rates. Second, using different metrics, we calibrate the behavioural models and compare them to each other and to the baseline. Including behavioural relaxation leads to a better fit of weekly deaths in three regions. However, the improvements are limited to a [Formula: see text] reduction in weighted mean absolute percentage errors and these gains are generally offset by models' increased complexity. Overall, we do not find clear signs of behavioural relaxation induced by COVID-19 vaccines on weekly deaths. Furthermore, our results suggest that if this phenomenon occurred, it generally involved only a minority of the population. Our work contributes to the retrospective validation of epidemic models developed amid the COVID-19 Pandemic and underscores the issue of non-identifiability of complex social mechanisms.
Copyright: © 2025 Li et al. This is an open access article distributed under the terms of the Creative Commons Attribution License, which permits unrestricted use, distribution, and reproduction in any medium, provided the original author and source are credited.
Conflict of interest statement
The authors have declared that no competing interests exist.
Figures
Similar articles
-
Measures implemented in the school setting to contain the COVID-19 pandemic.Cochrane Database Syst Rev. 2022 Jan 17;1(1):CD015029. doi: 10.1002/14651858.CD015029. Cochrane Database Syst Rev. 2022. Update in: Cochrane Database Syst Rev. 2024 May 2;5:CD015029. doi: 10.1002/14651858.CD015029.pub2. PMID: 35037252 Free PMC article. Updated.
-
Signs and symptoms to determine if a patient presenting in primary care or hospital outpatient settings has COVID-19.Cochrane Database Syst Rev. 2022 May 20;5(5):CD013665. doi: 10.1002/14651858.CD013665.pub3. Cochrane Database Syst Rev. 2022. PMID: 35593186 Free PMC article.
-
Factors that influence parents' and informal caregivers' views and practices regarding routine childhood vaccination: a qualitative evidence synthesis.Cochrane Database Syst Rev. 2021 Oct 27;10(10):CD013265. doi: 10.1002/14651858.CD013265.pub2. Cochrane Database Syst Rev. 2021. PMID: 34706066 Free PMC article.
-
Interventions to reduce harm from continued tobacco use.Cochrane Database Syst Rev. 2016 Oct 13;10(10):CD005231. doi: 10.1002/14651858.CD005231.pub3. Cochrane Database Syst Rev. 2016. PMID: 27734465 Free PMC article.
-
Parents' and informal caregivers' views and experiences of communication about routine childhood vaccination: a synthesis of qualitative evidence.Cochrane Database Syst Rev. 2017 Feb 7;2(2):CD011787. doi: 10.1002/14651858.CD011787.pub2. Cochrane Database Syst Rev. 2017. PMID: 28169420 Free PMC article.
References
MeSH terms
Substances
LinkOut - more resources
Full Text Sources
Medical
