. 2025 Jul 15;122(28):e2500579122.
doi: 10.1073/pnas.2500579122. Epub 2025 Jul 7.

p63 and ZNF148 cooperate to regulate head and neck squamous cell carcinoma

Affiliations

p63 and ZNF148 cooperate to regulate head and neck squamous cell carcinoma

Rosalba Pecorari et al. Proc Natl Acad Sci U S A. .

Abstract

Head and neck squamous cell carcinoma (HNSCC) is a common and aggressive malignancy. While significant advances have been made in the management of low-grade cancer, treatment of advanced HNSCC remains challenging. Here, we used a proteomic approach to find binding partners of the oncogene p63, the most frequently amplified transcription factor in HNSCC. We identified a zinc finger protein, ZNF148, which is coexpressed and physically binds p63 in carcinoma cells. Genome occupancy analyses identified a functional transcribed enhancer-derived RNA (eRNA) upstream of the CCND1 gene occupied by both factors. Mechanistically, p63 and ZNF148 control transcription of this eRNA, leading to overexpression of cyclin D1 to reinforce tumor cell proliferation. Importantly, this axis is specific for cancer cells and remains inactive in normal epithelial cells. The expression levels of these factors and the eRNA are positively correlated in cancer and associated with advanced stage and metastasis. Collectively, our data reveal a molecular pathway controlling HNSCC progression and identify potential selective targets for cancer treatment.

Keywords: CCND1; ZNF148; cancer; p63; transcription.


Conflict of interest statement

Competing interests statement:The authors declare no competing interest.

Figures
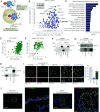
Fig. 1.
Fig. 1.
ZNF148 is a cofactor of p63. (A) Schematic of the BioID-MS technique. (B) Volcano plot showing identified p63 proximity partners based on the MS enrichment (compared with EV) and P value as well as correlation of the mRNA expression with TP63 levels in TCGA HNSC samples. (C) Bar plot showing Reactome pathway enrichment of identified cofactors of p63. (D) Scatter plots showing correlation between TP63 and ZNF148 expression in HNSCC samples (TCGA). (E) Scatter plots showing correlation between TP63 and ZNF148 mRNA expression in carcinoma cell lines (DepMAP). (F) Co-IP using anti-ZNF148 or anti-IgG antibodies in HEK293T cells transfected with either EV or ΔNp63α-ΗΑ. WB for ZNF148 and HA. (G) Co-IP using anti-p63 antibody in HEK293T cells transfected with either EV or ΔNp63α-ΗΑ. WB for ZNF148 and p63. (H) Co-IP using anti-ZNF148 antibody in FaDu cells. WB for p63 and ZNF148. (I) PLA between using p63 and ZNF148 or IgG antibodies in A253 knocked-down for p63 or ZNF148. Quantification of PLA-positive cells is shown on the Right. (J) Immunofluorescence of p63 and ZNF148 in normal skin (Left) or HNSCC tissue (Right). (Scale bar 200 μm.)
Fig. 2.
Fig. 2.
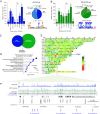
p63 and ZNF148 share common binding regions on chromatin. (A) Bar plot (Left) and pie chart (Right) of the distribution of p63 ChIP seq peaks in FaDu cells. Identified binding motif is shown at the Bottom. (B) Bar plot (Left) and pie chart (Right) of the distribution of ZNF148 ChIP seq peaks in FaDu cells. Identified binding motif is shown at the Bottom. (C) Venn diagram showing the intersection of p63 and ZNF148 common peaks. (D) Pathway ontology of common p63 and ZNF148 peaks associated genes. (E) Co-occupancy analysis of p63 and ZNF148 peaks on chromatin in FaDu cells. (F) UCSC genome browser visualization of signal tracks of p63 and ZNF148 around CCND1 locus on chromosome 11. Single and shared peaks are shown. Co-occupied loci are shown by arrows.
Fig. 3.
Fig. 3.
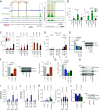
p63 and ZNF148 promote the expression of CCND1. (A) UCSC genome browser visualization of signal tracks of p63 and ZNF148 around CCND1 locus on chromosome 11. Single peaks, shared peaks, and FANTOM5 enhancers are shown. Enlarged CCND1 promoter region is shown on the Right. Putative distal (Peak1/2/3) and proximal (Pr1/2/3) regulatory elements are highlighted by beige shading. (B) ChIP-qPCR analysis of ZNF148 and H3K27ac occupancy on proximal CCND1 promoter regions Pr1/2/3. Data are shown as mean ± SD. n = 3 (biological replicates). P by Student’s t test. (C) ChIP-qPCR analysis of p63, ZNF148, and H3K27ac occupancy on distal CCND1 regions Peak1/2/3. Data are shown as mean ± SD. n = 3-4 (biological replicates). P by Student’s t test. (D) ChIP-re-ChIP qPCR analysis of p63/ZNF148 co-occupancy on distal CCND1 regions Peak1/2/3. Data are shown as mean ± SD. n = 3 (biological replicates). P by two-way ANOVA. (E) CCND1 mRNA and protein levels in FaDu cells transfected with p63 or ZNF148 (#1 and #2) siRNAs for 48 h. Data are shown as mean ± SD. n = 3 (biological replicates). P by one-way ANOVA. β-tubulin as a loading control. (F) CCND1 mRNA and protein levels in FaDu cells transfected with eRNA1 or eRNA3 siRNAs for 48 h. Data are shown as mean ± SD. n = 3 (biological replicates). P by one-way ANOVA. β-tubulin as a loading control. (G) eRNA3 levels in FaDu cells transfected with p63 or ZNF148 (#1 and #2) siRNAs for 48 h. Data are shown as mean ± SD. n = 3 (biological replicates). β-tubulin as a loading control. (H) Co-IP using anti-DNMT3A or anti-IgG antibodies in FaDu cells. WB for DNMT3A, ZNF148, and p63. (I) ChIP-qPCR analysis of DNMT3A occupancy on Peak3 in FaDu, A253, and HEKn cells. Data are shown as mean ± SD. n = 4 (biological replicates). P by Student’s t test. (J) meDIP-qPCR analysis of methylated DNA within Peak3 region in FaDu, A253, and HEKn cells. Data are shown as mean ± SD. n = 4 (biological replicates). P by Student’s t test. (K) (Left) ChIP-qPCR analysis of p63 and ZNF148 occupancy on Peak3 in CRISPR/Cas9 FaDu clones after 72 h induction with 2 μg/mL of doxycycline. Data are shown as mean ± SD of n = 6 individual clones. P by Student’s t test. (Right) ChIP-qPCR analysis of DNMT3A occupancy on Peak3 in CRISPR/Cas9 FaDu clones after 72 h induction with 2 μg/mL of doxycycline. Data are shown as mean ± SD of n = 5 individual clones. P by Student’s t test. (L) CCND1 mRNA and protein levels in CRISPR/Cas9 FaDu clones after 72 h induction with 2 μg/mL of doxycycline. Data are shown as mean ± SD of n = 4 to 6 individual clones per gRNA. P by Student’s t test. β-tubulin as a loading control.
Fig. 4.
Fig. 4.
p63 and ZNF148 control HNSCC cell proliferation. (A) CCND1, pRb, and ppRb S795 protein levels in FaDu cells transfected with p63 or ZNF148 (#1 and #2) siRNAs for 48 h. (Right) Densitometry of CCND1 and ppRb S795 protein levels in the same samples. Data are shown as mean ± SD. n = 3-4 (biological replicates). P by one-way ANOVA. β-tubulin as a loading control. (B) CCND1, pRb, and ppRb S795 protein levels in A253 cells transfected with p63 or ZNF148 (#1 and #2) siRNAs for 48 h. (Right) Densitometry of CCND1 and ppRb S795 protein levels in the same samples. Data are shown as mean ± SD. n = 3-4 (biological replicates). P by one-way ANOVA. β-tubulin as a loading control. (C) Clonogenic assay of FaDu or A253 cells transfected with p63 or ZNF148 (#1 and #2) siRNAs. Representative images (Top) and bar plots showing the number of clones (Bottom) are shown. Data are shown as mean ± SD. n = 3-4 (biological replicates). P by one-way ANOVA. (D) Growth curve and EdU incorporation assay in the FaDu (Top) or A253 (Bottom) cells transfected with p63 or ZNF148 (#1 and #2) siRNAs. Data are shown as mean ± SEM (growth curve) or SD (EdU incorporation assay). n = 3 (biological replicates). P by one-way ANOVA. (E) Western blot analysis of ZNF148 expression in FaDu Tet-On shZNF148 inducible cells. β-actin as a loading control. (F) Xenograft tumors of FaDu Tet-On shZNF148 inducible cells in immunodeficient B-NDG mice. Cartoon depicts workflow of experiment. Photograph shows harvested doxycycline-inducible FaDu-shZNF148 tumors. (Scale bar 1 mm.) n = 7 mice for each group. (G) (Left) Violin plot showing weight of harvested tumors. P by one-way ANOVA. (Right) Line plot showing tumor volume in time. P by one-way ANOVA compared with “no doxy.” (H) Violin plots showing H-scores of ZNF148 expression (Left) or % of Ki67 positive cells (Right) in tumors from (F). (I) Violin plots showing mean number of FISH eRNA3 foci per cell (Left) or number of eRNA3 positive cells (>0 FISH foci) in samples from (F). n = 4 (no doxy) and n = 3 (doxy) mice. P by one-way ANOVA. Representative FISH images are shown on the Right. (J) EdU incorporation assay of CRISPR/Cas9 FaDu clones after 72 h induction with 2 μg/mL of doxycycline. Data are shown as mean ± SD of n = 3-5 individual clones. P by one-way ANOVA.
Fig. 5.
Fig. 5.
The p63/ZNF148/CCND1 axis is associated with HNSCC aggressiveness. (A) TP63, ZNF148, CCND1, and eRNA3 mRNA levels in clinical samples. NT, n = 48; I–II (tumor tissue stage I–II), n = 24; III–IV (tumor tissue stage III–IV), n = 24. P by Student’s t test. (B) Correlation between TP63, ZNF148, CCND1, and eRNA3 RNA levels in clinical samples. n = 48. (C) TP63, ZNF148, CCND1, and eRNA3 mRNA levels in clinical samples. LN- (nonlymph nodes metastasis), n = 30; LN+ (lymph nodes metastasis), n = 18. P by Student’s t test. (D) Correlation between TP63, ZNF148, CCND1, and eRNA3 RNA levels in clinical samples. LN+ (lymph nodes metastasis), n = 21. (E) Heatmap of p63, ZNF148, CCND1, and Ki67 TMA (Tissue Micro Array) histological scores of expression (H-scores). (F) Representative TMA spots of p63, ZNF148, CCND1, and Ki67 at stage I, stage III, and stage IV (scale bar, 50 μm, scale bar, 10 μm). (G) Bar plot of p63, ZNF148, CCND1, and Ki67 H-score in NT or tumor samples based on stages. P by Student’s t test. (H) Pearson correlation between p63, ZNF148, and CCND1 levels in samples from (E). (I) The Kaplan–Meier survival plots of HNSCC patients from the CPTAC study based on p63 or ZNF148 protein expression levels.
Fig. 6.
Fig. 6.
p63–ZNF148 complex regulated CCND1 expression in HNSCC. Graphical representation of the enhancer regions upstream of the CCND1 TSS. In HNSCC, p63–ZNF148–DNMT3A complex is recruited on the enhancer 3 region (peak 3) upstream of the CCND1 TSS. ZNF148 also binds the CCND1 promoter. p63/ZNF148 complex is important to drive uncontrolled proliferation in HNSCC.

References

    1. Johnson D. E., et al. , Head and neck squamous cell carcinoma. Nat. Rev. Dis. Primers 6, 92 (2020). - PMC - PubMed
    1. Maghami E., et al. , Diagnosis and management of squamous cell carcinoma of unknown primary in the head and neck: ASCO guideline. J. Clin. Oncol. 38, 2570–2596 (2020). - PubMed
    1. Mody M. D., Rocco J. W., Yom S. S., Haddad R. I., Saba N. F., Head and neck cancer. Lancet 398, 2289–2299 (2021). - PubMed
    1. Lo Nigro C., Denaro N., Merlotti A., Merlano M., Head and neck cancer: Improving outcomes with a multidisciplinary approach. Cancer Manag. Res. 9, 363–371 (2017). - PMC - PubMed
    1. Gupta G. P., Massagué J., Cancer metastasis: Building a framework. Cell 127, 679–95 (2006). - PubMed

MeSH terms

LinkOut - more resources