. 2025 Jul 7;13(7):e011330.
doi: 10.1136/jitc-2024-011330.

Precision targeting of rhabdomyosarcoma by combining primary CAR NK cells and radiotherapy

Affiliations

Precision targeting of rhabdomyosarcoma by combining primary CAR NK cells and radiotherapy

Lisa Marie Reindl et al. J Immunother Cancer. .

Abstract

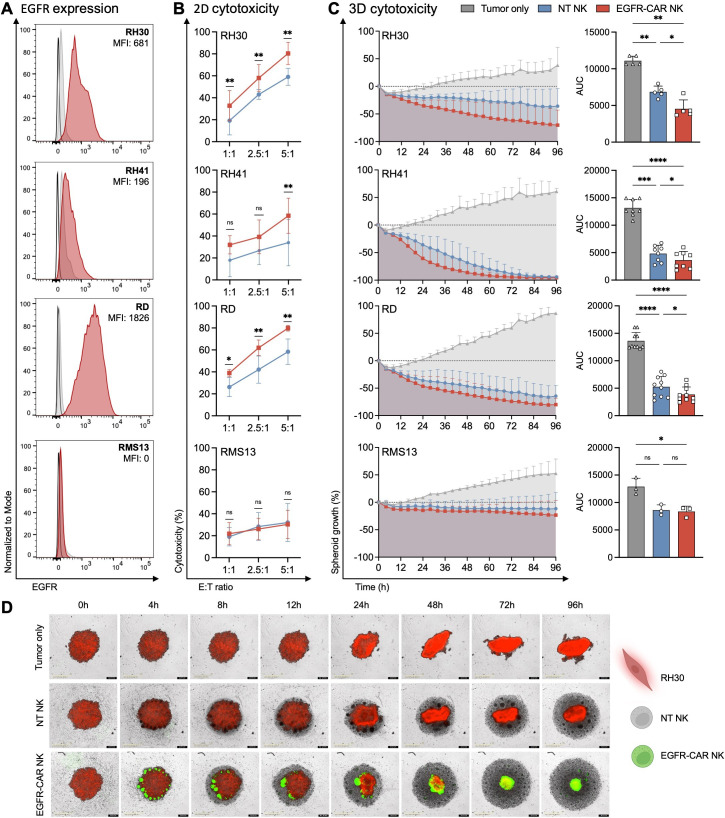
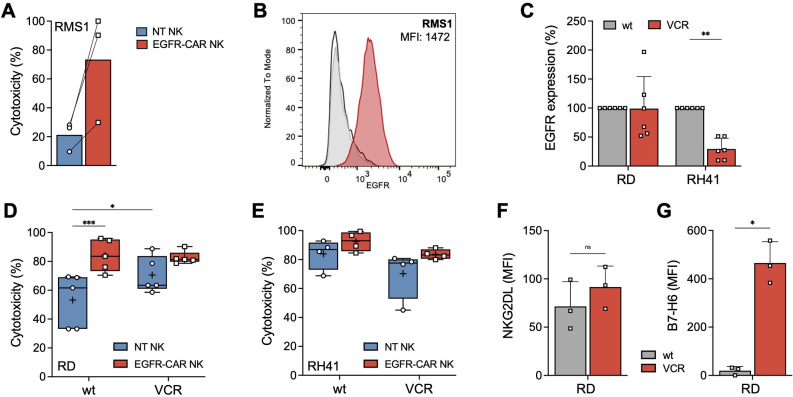
Background: Rhabdomyosarcoma (RMS) is the most common type of soft-tissue sarcoma in children, and it remains a challenging cancer with poor outcomes in high-risk and metastatic patients. This study reports the use of epidermal growth factor receptor (EGFR)-targeted chimeric antigen receptor (CAR) natural killer (NK) cells in combination with radiotherapy as a novel immunotherapeutic approach for RMS treatment.Methods: Primary human NK cells from healthy donors were engineered using lentiviral transduction to express a cetuximab-based EGFR-specific CAR. The ability of the engineered NK cells to lyse RMS cells was then assessed in vitro in RMS monolayers and spheroids, as well as against chemotherapy-resistant and primary patient-derived RMS cells. Migratory properties of NK cells were observed in a subcutaneous RMS xenograft model using in vivo imaging, and the efficacy of EGFR-CAR NK cells in combination with localized fractionated radiotherapy was analyzed.Results: Primary human EGFR-CAR NK cells demonstrated enhanced cytotoxicity against multiple RMS cell lines in both two-dimensional culture and three-dimensional spheroid models. Furthermore, EGFR-CAR NK cells were highly efficient against chemotherapy-resistant RMS cells and patient-derived samples. Importantly, EGFR-CAR NK cells also exhibited improved tumor homing compared with non-transduced NK cells in an in vivo RMS xenograft model. Notably, the combination of EGFR-CAR NK cell therapy with fractionated radiotherapy further enhanced NK cell infiltration into the tumor and reduced tumor growth.Conclusion: This study provides a proof-of-concept for EGFR-CAR NK cells as a promising immunotherapy for RMS, particularly when combined with radiotherapy to overcome barriers of solid tumors. This combinatorial approach may hold potential to improve outcomes for patients with RMS and other EGFR-expressing malignancies.

Keywords: Chimeric antigen receptor - CAR; Immunotherapy; Natural killer - NK; Radiotherapy/radioimmunotherapy; Solid tumor.


Conflict of interest statement

Competing interests: EU has a sponsored research project with Gilead and BMS and acts as a medical advisor for Phialogics and CRIION. HB has obtained research support from Bayer, Chugai, Erydel, Fresenius, Miltenyi, Sandoz-Hexal (a Novartis Company), Terumo BCT, honoraria or speakers‘ fees from BMS/Celgene, Fresenius, Kiadis, Miltenyi, Novartis, has served as consultant or on advisory boards of Apriligen, Arensia, Boehringer Ingelheim Vetmed, BMS/Celgene, Editas, medac, NMDP, Novartis, Sandoz-Hexal, receives royalties from medac and owns stock from Healthineers. The other authors have no competing interests to declare.

Figures

Figure 1
Figure 1. EGFR-CAR NK cells efficiently eradicate EGFR-positive rhabdomyosarcoma (RMS) cells in vitro. (A) A construct encoding a second-generation CAR (225.28.z) was used for lentiviral transduction of NK cells. The CAR sequence under the control of the spleen focus forming virus (SFFV) promoter consists of an immunoglobulin heavy chain signal peptide (SP), a single chain fragment (scFv) based on the clinically used antibody cetuximab, a CD8α hinge region, followed by transmembrane (TM) and costimulatory domains of CD28 and a CD3ζ signaling domain. Enhanced green fluorescent protein (EGFP) linked via an internal ribosome entry site (IRES) was used as a marker for transgene expression. (B) Schematic of the CAR NK cell production workflow starting with primary NK cells from healthy donor buffy coats and subsequent lentiviral transduction. Cytotoxic activity of the generated CAR NK cells was assessed between days 14 and 24 post-transduction. (C) CAR expression was analyzed by flow cytometry using EGFP as a reporter gene (red). Non-transduced (NT) NK cells (blue) served as control. (D) CAR expression was detected in 50–60% of NK cells and remained stable for at least 30 days (n=3–23). (E) The receptor repertoire of primary NT (blue circles) and EGFR-CAR NK cells (red squares) was analyzed by flow cytometry (n=3). (F) Cytotoxic activity of expanded EGFR-CAR NK cells was investigated against alveolar (RH30, RH41) and embryonal (RD) RMS cell lines at an effector-to-target (E:T) ratio of 5:1 after 4 hours (n=16–23). EGFR-negative RMS cells (RMS13) served as control (n=6). The graphs show all individual data points, with the black middle line representing the median value, and the mean indicated by a plus (+) sign. Data were analyzed by two-way analysis of variance followed by Šídák’s multiple comparison test. (G, H) Apoptosis induction by EGFR-CAR NK (red squares) compared with NT NK cells (blue circles) was analyzed via annexin V staining using the IncuCyte Live-Cell Analysis Platform at different E:T ratios ranging from 2.5:1 to 1:10. Data for one representative NK cell donor against the FP-RMS cell line RD (G) and the FN-RMS cell line RH30 (H, left panel) are shown. Images taken after 24 hours of co-incubation display remaining RH30 cells (red), NT NK cells (gray), EGFR-CAR NK cells (green) and apoptosis induction by annexin V staining (cyan) (H, right panel). CAR, chimeric antigen receptor; GFP, green fluorescent protein; IL, interleukin; NK, natural killer; RMS, rhabdomyosarcoma.
Figure 2
Figure 2. EGFR-CAR NK cells display high antitumor activity at low effector-to-target cell ratios and in 3D RMS spheroid models. (A) EGFR surface expression was analyzed by flow cytometry on four RMS cell lines (RH30, RH41, RD, RMS13). MFI values indicate relative EGFR expression levels. The EGFR-negative RMS cell line RMS13 served as a control. (B) Cytotoxic activity of NT NK (blue circles) and EGFR-CAR NK cells (red squares) was assessed after 4 hours of co-cultivation at different effector-to-target (E:T) cell ratios (1:1, 2.5:1, 5:1) against the fusion-positive-RMS cell lines RH30 and RH41 and the fusion-negative-RMS cell line RD (n=4–6) using a luciferase-based assay. EGFR-negative RMS13 cells were included to assess CAR-independent natural cytotoxicity. Data were analyzed by two-way ANOVA followed by Šídák’s multiple comparisons test. (C) Eradication of RMS spheroids by EGFR-CAR NK (red squares) compared with NT NK cells (blue circles) was monitored over time by live-cell imaging using the IncuCyte platform for up to 96 hours at an E:T ratio of 1:1. AUC measurements were used to quantify NK cell cytotoxicity against RMS spheroids (n=3–10). Data were analyzed using repeated measures one-way ANOVA followed by Holm-Šídák’s multiple comparisons test. (D) Representative time-lapse images of RH30 spheroids (red) in combination with NT NK cells (gray) or EGFR-CAR NK cells (green). ANOVA, analysis of variance; AUC, area under the curve; CAR, chimeric antigen receptor; EGFR, epidermal growth factor receptor; MFI, geometric mean fluorescence intensity ;NK, natural killer; NT, non-transduced; RMS, rhabdomyosarcoma; 2D, two-dimensional; 3D, three-dimensional.
Figure 3
Figure 3. EGFR-targeted CAR NK cells demonstrate effectiveness against patient-derived primary RMS and chemotherapy-resistant RMS cell lines. (A) Activity of EGFR-CAR NK cells (red squares) and NT NK cells (blue circles) against a primary FP-RMS cell isolate (RMS1) derived from a patient with progressive disease was compared after 4 hours of co-incubation (E:T ratio 5:1, n=3). Data were analyzed by paired t-test. Only statistically significant comparisons are indicated. (B) EGFR expression by RMS1 cells was assessed by flow cytometry (n=3). One representative measurement is shown. (C) EGFR expression by parental and VCR-resistant RMS cell lines RD and RH41 was determined using flow cytometry. EGFR expression by VCR-resistant cell lines is indicated relative to the corresponding parental cell lines (100%). Results were analyzed using two-way ANOVA followed by Šídák’s multiple comparison test. (D, E) Cytotoxic activity of EGFR-CAR NK cells (red squares) and NT NK cells (blue circles) against the parental (wt) FN-RMS cell line RD (D), the FP-RMS cell line RH41 (E) and the corresponding VCR-resistant variants was investigated in 4-hour cytotoxicity assays at an E:T ratio of 5:1. Data were analyzed using two-way ANOVA followed by Fisher’s LSD test (n=4–5). All individual data points, as well as minimum and maximum values are shown. The black-centered line represents the median. The mean is indicated by a plus (+) sign. Only statistically significant differences are indicated. (F, G) Expression of NKG2DL and B7-H6 by parental and VCR-resistant cell lines was analyzed by flow cytometry (n=3). Results are indicated as MFI and were analyzed using a paired t-test. ANOVA, analysis of variance; CAR, chimeric antigen receptor; EGFR, epidermal growth factor receptor; E:T, effector-to-target; FN, fusion-negative; FP, fusion-positive; LSD, least significant difference; NK, natural killer; NKG2DL, NKG2D ligands; NT, non-transduced; MFI, geometric mean fluorescence intensity; RMS, rhabdomyosarcoma; VCR, vincristine; wt, wildtype.
Figure 4
Figure 4. EGFR-CAR NK cells home to established RMS tumor xenografts in NSG mice. (A) Pre-labeled EGFR-CAR or NT NK cells were ii.v injected into s.c RMS tumor-engrafted mice 40 days post tumor implantation, and in vivo homing was analyzed for 5 days. (B) Tumor growth was assessed by bioluminescence imaging (top row). NK cell migration was analyzed using fluorescence imaging (bottom rows) at different time points after NK cell injection: 24, 48 and 120 hours. Unspecific fluorescence signal was quantified 1 hour before NK cell administration. (C) NK cell trafficking to the tumor site and persistence was quantified over the 5 days observation period and analyzed by two-way ANOVA followed by Holm-Šídák’s multiple comparisons test (n=3). (D) Immunofluorescence analysis of tumor sections was performed to assess infiltration of NK cells (CD45, red) deep into the tumor (GFP, green) tissue. (E) Spleen sections were analyzed for comparison. ANOVA, analysis of variance; CAR, chimeric antigen receptor; EGFR, epidermal growth factor receptor; IL, interleukin; i.v., intravenous; NK, natural killer; NT, non-transduced; RMS, rhabdomyosarcoma; s.c., subcutaneous.
Figure 5
Figure 5. Radiation enhances chemokine secretion and NK cell-mediated tumor control in r RMS models. (A, B) Experimental timeline for co-culture of irradiated RD cells with NT NK cells in 2D monolayer (A) or 3D spheroid assays (B). (C) Tumor growth over time after exposure to radiation, co-incubation with NT NK cells (E:T) ratio of 1:10) or a combination analyzed by live cell imaging in 2D monolayer culture (n=4). AUC measurements were used to quantify NK cell cytotoxicity and data were analyzed using repeated measures one-way ANOVA followed by Holm-Šídák’s multiple comparisons test. (D) Spheroid growth upon irradiation, NT or EGFR-CAR NK cell treatment and combinatorial regimens was assessed for 68 hours (three individual NK donors, E:T ratio 1:1). (E, F) Quantification of IL-8 and CCL2 levels in supernatants from 2D (E) and 3D (F) assays. Samples were measured in duplicates and biological replicates are indicated by different symbols. Data were analyzed using Friedman’s test followed by Dunn’s multiple comparison test. (G) In vivo BLI of tumor-bearing mice at 0, 24 and 48 hours post-treatment. NK cell migration was analyzed by fluorescence imaging. (H) NK cell trafficking to the tumor site was quantified at 24 and 48 hours and normalized to control mice (tumor only). The mean total flux of all replicates analyzed from figures 5G and 4B is indicated. Data were analyzed using ordinary one-way ANOVA followed by Holm-Šídák’s multiple comparisons test (n=3–6). (I) NK cell fluorescence values 24 hours after NK cell application (G) were normalized to the tumor signals quantified by BLI for each group and analyzed by Kruskal-Wallis test followed by Dunn’s multiple comparisons test (n=3 per group). ANOVA, analysis of variance; AUC, area under the curve; BLI, bioluminescence imaging; CAR, chimeric antigen receptor; CCL2, C-C motif chemokine ligand 2; EGFR, epidermal growth factor receptor; E:T, effector-to-target; IL, interleukin; NK, natural killer; NT, non-transduced; 2D, two-dimensional; 3D, three-dimensional.
Figure 6
Figure 6. Combination of radiotherapy and adoptive EGFR-CAR NK cell therapy inhibits RMS tumor growth in vivo. (A) Experimental design: RMS tumors were established by s.c. injection of RD cells followed by fractionated radiation (10×2.5 Gy). Four consecutive doses of either cryopreserved (blue syringe) or freshly prepared (gray syringe) EGFR-CAR or NT NK cells were administered i.v. as indicated. (B) Tumor growth was assessed by caliper measurements for each treatment group (n=6): untreated mice (dark gray), radiotherapy (light gray), radiotherapy+NT NK (blue) and radiotherapy+EGFR CAR NK cells (red). (C) The AUC was calculated to determine treatment effects over time. Data were analyzed using one-way ANOVA followed by Holm-Šídák’s multiple comparisons test (n=6). Only statistically significant differences are indicated. (D, E) Tumor progression was compared between each treatment group after the last NK cell administration on day 53 to investigate the contribution of NK cell therapy after radiation. Data were analyzed by two-way ANOVA followed by Holm-Šídák’s multiple comparison test. Minimum and maximum values are shown. The black centered line indicates the median. The mean is represented by a plus (+) sign. Only statistically significant differences are indicated. (F) Final tumor sizes were assessed during endpoint analysis at the time of sacrifice and grouped into four categories as indicated. (G, H) Immunofluorescence analysis of spleen (G) and tumor sections (H) from one representative animal of each treatment group. Nuclei/DAPI (blue), CD45 (red), EGFR (green). ANOVA, analysis of variance; AUC, area under the curve; BLI, bioluminescence imaging; CAR, chimeric antigen receptor; DAPI, 4′,6-diamidino-2-phenylindole; EGFR, epidermal growth factor receptor; IL, interleukin; i.v., intravenous; NK, natural killer; NT, non-transduced; RMS, rhabdomyosarcoma; s.c., subcutaneous.

References

    1. Hawkins DS, Spunt SL, Skapek SX, et al. Children’s Oncology Group’s 2013 blueprint for research: Soft tissue sarcomas. Pediatr Blood Cancer. 2013;60:1001–8. doi: 10.1002/pbc.24435. - DOI - PMC - PubMed
    1. Evans C, Shepherd L, Bryan G, et al. A systematic review of early phase studies for children and young people with relapsed and refractory rhabdomyosarcoma: The REFoRMS-SR project. Int J Cancer. 2024;154:1235–60. doi: 10.1002/ijc.34808. - DOI - PubMed
    1. Heske CM, Mascarenhas L. Relapsed Rhabdomyosarcoma. J Clin Med. 2021;10:804. doi: 10.3390/jcm10040804. - DOI - PMC - PubMed
    1. Vivier E, Rebuffet L, Narni-Mancinelli E, et al. Natural killer cell therapies. Nature New Biol. 2024;626:727–36. doi: 10.1038/s41586-023-06945-1. - DOI - PubMed
    1. Reindl LM, Albinger N, Bexte T, et al. Immunotherapy with NK cells: recent developments in gene modification open up new avenues. Oncoimmunology. 2020;9:1777651. doi: 10.1080/2162402X.2020.1777651. - DOI - PMC - PubMed

LinkOut - more resources