. 2025 Jul 8;16(1):6270.
doi: 10.1038/s41467-025-60884-1.

JAK2 inhibition mediates clonal selection of RAS pathway mutations in myeloproliferative neoplasms

Affiliations

JAK2 inhibition mediates clonal selection of RAS pathway mutations in myeloproliferative neoplasms

Nabih Maslah et al. Nat Commun. .

Abstract

JAK (Janus Kinase) inhibitors, such as ruxolitinib, were introduced a decade ago for treatment of myeloproliferative neoplasms (MPN). To evaluate ruxolitinib's impact on MPN clonal evolution, we interrogate a myelofibrosis patient cohort with longitudinal molecular evaluation and discover that ruxolitinib is associated with clonal outgrowth of RAS pathway mutations. Single-cell DNA sequencing combined with ex vivo treatment of RAS mutated CD34+ primary patient cells, demonstrates that ruxolitinib induces RAS clonal selection both in a JAK/STAT wild-type and hyper-activated context. RAS mutations are associated with decreased transformation-free and overall survival only in patients treated with ruxolitinib. In vitro and in vivo competition assays demonstrate increased cellular fitness of RAS-mutated cells under ruxolitinib or JAK2 knock-down, consistent with an on-target effect. MAPK pathway activation is associated with JAK2 downregulation resulting in enhanced oncogenic potential of RAS mutations. Our results prompt screening for pre-existing RAS mutations in JAK inhibitor treated patients with MPN.


Conflict of interest statement

Competing interests: L.B. received research funding from Gilead and Pfizer for unrelated projects, and personal fees from BMS, Novartis and GSK outside of the submitted work. N.G. received personal fees from Novartis, Abbvie and Astra Zeneca outside of the submitted work. K.S. is on the SAB and has stock options in Auron Therapeutics and received grant funding from Novartis and KronosBio on topics unrelated to this manuscript. The remaining authors declare no competing interests.

Figures
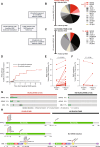
Fig. 1
Fig. 1. Ruxolitinib treatment is associated with the accumulation of RAS signaling pathway mutations in patients with myelofibrosis.
A Flow-chart depicting the patients included in the study according to their exposure to ruxolitinib treatment and molecular data availability. B, C Pie Charts depicting the additional mutations longitudinally newly identified in patients with myelofibrosis exposed (n = 45) (B) or not exposed (n = 28) (C) to ruxolitinib between baseline and follow-up molecular evaluation. D Cumulative Hazard curve of the acquisition of RAS pathway mutations for ruxolitinib-treated patients (n = 45) compared to non-ruxolitinib-treated patients (n = 28) with molecular follow-up available. Two-sided COX proportional hazards regression was used for comparing the groups. P-value reported in the figure. E, FRAS mutations variant allele frequency longitudinal evolution in patients with myelofibrosis exposed (n = 45) (E) or not exposed (n = 28) (F) to ruxolitinib between baseline and follow-up molecular evaluation. Variant allele frequency was considered zero when mutations were absent at baseline or follow-up molecular evaluation. Statistical significance determined using two-sided Mann-Whitney test in comparison to baseline molecular evaluation. P-values reported in the figure. G, H Oncoprints (G) and lollipop plots (H) showing RAS pathway mutations in patients treated with ruxolitinib (n = 45) compared to patients not treated with ruxolitinib (n = 28). N-term = N-terminal domain 1, EF = EF hand-like domain, SH2 = SH2-like domain, ZF=Zinc finger, C3HC4 type (RING finger), U = UBA/TS-N domain. Source data are provided as a Source Data file.
Fig. 2
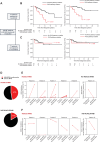
Fig. 2. RAS pathway mutations adversely impact MPN patient prognosis and are associated with RAS driven leukemic transformation, only in the context of ruxolitinib treatment.
A Flow-chart depicting the patients included in the study according to their exposure to ruxolitinib treatment prior to their last NGS molecular evaluation. B, C Kaplan-Meier curves of overall survival (left) or transformation-free survival (right), for ruxolitinib treated (B) or non-ruxolitinib-treated (C) patients according to the presence of RAS pathway mutations. Two-sided COX proportional hazards regression analysis was used to compare the groups. P-value reported in the figure. D Pie Chart depicting the proportion of AML/MDS transformations among RAS-mutated patients, treated (n = 8/17) or not with ruxolitinib (n = 1/6). E, F Evolution of RAS (E) and ASXL1 (F) mutations variant allele frequency (VAF) between two time points: prior to ruxolitinib initiation and at time of AML/MDS transformation, for RAS-mutated MPN patients treated or not with ruxolitinib. Data was available for n = 5/8 ruxolitinib-treated patients and n = 1/1 non-ruxolitinib-treated patients. Source data are provided as a Source Data file.
Fig. 3
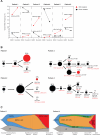
Fig. 3. Ruxolitinib treatment positively selects RAS mutant clones both in a JAK/STAT hyper-activated and wild-type (WT) context.
A Graphical representation of the allele burden of RAS mutations and driver mutations detected 10 days after DMSO or ruxolitinib (20 nM) in vitro treatment of CD34+ hematopoietic cells derived from six MPN patients harboring RAS mutations. B Clonal architecture of CD34+ hematopoietic cells derived from targeted single-cell DNA sequencing of samples from four patients with MPN harboring RAS mutations. Each circle represents a single clone with the corresponding mutated genes below (Het = heterozygous, Hom = homozygous). Mutations acquired at each step are written in red. Red circles correspond to RAS-mutated clones. C Fish Plots depicting clonal evolution between MPN diagnosis and last molecular evaluation for two patients with MPN treated with ruxolitinib. RAS-mutated clones are highlighted in red. Source data are provided as a Source Data file.
Fig. 4
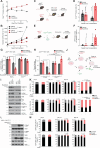
Fig. 4. MAPK activation confers fitness advantage and increased clonogenic potential to JAK2V617F and JAK2WT hematopoietic cells upon ruxolitinib.
A Percentage of CD45.1/2 NrasG12D cells among CD45.1/2 NrasG12D and CD45.1 NrasWT Lin murine cells (50/50 ratio) treated with DMSO or ruxolitinib (0.25 µM). B Proliferation curves of NrasG12D or NrasWT Lin cells after DMSO or ruxolitinib (0.25 µM). A, B Mean of n = 2 biological replicates. C In vivo NrasG12D competition model. Created in BioRender. D Percentage of CD45.1/2 NrasG12D cells in peripheral blood of mice transplanted with 10% CD45.1/2 Jak2WT NrasG12D and 90% CD45.2 Jak2V617F NrasWT Lin cells (n = 4 per group). Ruxolitinib (90 mg/kg twice daily) was started 4 weeks post-transplantation. E In vivo NrasQ61K competition model. Created in BioRender. F Percentage of GFP+ NrasQ61K Jak2V617F cells in the bone marrow of mice transplanted with Jak2V617F cells expressing a GFP+ NrasQ61K vector (n = 5 per group). Ruxolitinib (90 mg/kg twice daily) was started 3 weeks post-transplantation. G, H Colony formation assay for cKit+ bone marrow cells from Jak2WT (G) or Jak2V617F (H) mice expressing Empty or NrasQ61K vectors. Colony number after at least 6 days of DMSO or ruxolitinib (1 µM) (n = 4 biological replicates). I Western blot for the indicated proteins in HEL cells expressing GFP, Empty or NRASQ61K vectors, treated 24 h with ruxolitinib (3 µM). J In vitro competition model. Created in BioRender. K Percentage of GFP+ and GFP_Empty or GFP_NRASQ61K HEL or UKE-1 cells. 24 days after ruxolitinib (3 µM and 15 µM for HEL and UKE-1, respectively), the indicated cells were treated 3 days with ruxolitinib or ruxolitinib (Ruxo.) and trametinib (Trame.) (10 µM and 0.1 µM for HEL and UKE-1, respectively) (n = 3 biological replicates). L Western blot for the indicated proteins in Ba/F3 MPL-CALRWT and MPL-CALRdel52 cells expressing Empty or NRASQ61K vectors, treated 24 h with ruxolitinib (75 nM). M Percentage of Crimson+ and Crimson_Empty or Crimson_NRASQ61K Ba/F3 MPL-CALRWT and MPL-CALRdel52 cells after ruxolitinib (n = 3 biological replicates). Statistical significance using two-tailed Mann–Whitney (D, F) or Welch’s t-test (H, K, M). Experiments(I, L) were performed twice with similar results. Error bars represent mean ± SEM. P-values in the figure. Source data provided as Source Data file. Schemas created using BioRender.
Fig. 5
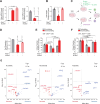
Fig. 5. JAK2 targeting is responsible for the effects of ruxolitinib on the fitness advantage of NRAS mutant cells and their increased clonogenic potential.
A qRT-PCR for Nras and Jak2 expression level in murine 32D cells infected with an Empty, a NrasQ61K or a NrasQ61K-shJak2 encoding vector. Statistical significance was determined using a two-tailed Welch’s t-test. Error bars represent the mean of n = 4 biological replicates ± SEM. B Growth inhibition of 32D murine cells expressing an Empty, a NrasQ61K or a NrasQ61K-shJak2 encoding vector 6 days after GFP sorting. Statistical significance was determined using a two-tailed Welch’s t-test. Error bars represent the mean of n = 6 biological replicates ± SEM. C Model of the in vitro NrasQ61K-shJak2 murine myeloid cells competition assay. Created in BioRender. D Percentage of GFP+_CRIMSON 32D cells expressing an Empty, a NrasQ61K or a NrasQ61K_shJak2 encoding vector 3 days after sorting. Statistical significance was determined using two-tailed Welch’s t-test. Error bars represent mean of n = 3 biological replicates ± SEM. E–F Colony formation assay of Jak2WT (E) or Jak2V617F (F) C57BL/6 primary bone marrow c-Kit+ murine cells expressing an Empty, a NrasQ61K or a NrasQ61K-shJak2 encoding vector at least 6 days after GFP sorting. Statistical significance was determined using a two-tailed Welch’s t-test. Error bars represent the mean of n = 4 biological replicates ± SEM. G Genetic variants association with resistance to the JAK2 inhibitors ruxolitinib (n = 497), momelotinib (n = 476) and fedratinib (n = 93) according to the Beat AML v2 human primary patient AML dataset. Data is presented as volcano plots for gene variants' effect size (Glass) on the x-axis versus –log10(P-value) on the y-axis. Significance was set at – log10(P-value)>1.3, based on the two-tailed Student t-test with Welch’s correction, with variants having a negative effect size associated with drug sensitivity (red), while those having a positive effect size associated with drug resistance (blue). P-values are reported in the figure. Source data provided as a Source Data file.
Fig. 6
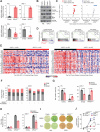
Fig. 6. JAK2 downregulation increases NRAS mutated cells oncogenic potential through cellular release from oncogene-induced senescence.
ANRAS and JAK2 expression level qRT-PCR in Empty or NRASQ61K HEL and UKE-1 cells. Error bars represent mean of n = 3 (HEL) and n = 4 (UKE-1) biological replicates ± SD. B Western blot for indicated proteins, in Empty or NRASQ61K HEL and UKE-1. The experiment was performed twice with similar results. C, D Gene Set Enrichment Analysis (GSEA) for the AML dataset Beat_AML_v2, across the collection of MSigDB_v7.4 Hallmark (50) and additional RAS/MAPK (24) and cell cycle (11) gene sets. Data represented as volcano plots (C) of –log10(p-value + 0.0001) versus the Normalized Enrichment Score (NES) for each gene set. NES using Kolmogorov-Smirnov enrichment test. Gene sets related to RAS/MAPK and Cell Cycle highlighted in red and blue respectively. Gray dots indicate all other. Representative GSEA plots (D) for gene sets related to RAS/MAPK and Cell Cycle. E Heatmaps depicting relative gene expression changes for leading edge genes of the top RAS/MAPK and Cell Cycle enriched gene sets. Depleted and enriched genes are respectively in blue and red. Row-normalized data. F Propidium Iodide cell cycle analysis of Empty or NRASQ61K HEL and UKE-1 cells after 11 or 9 days of ruxolitinib (3 and 15 µM, respectively). Cells in sub G1 not represented. Mean of n = 2 biological replicates. G EdU incorporation of Empty or NRASQ61K HEL and UKE-1 cells after 12 days of ruxolitinib (3 and 15 µM, respectively). Error bars represent the mean of n = 3 biological replicates ± SEM. H, I Beta-galactosidase staining for Empty or NRASQ61K HEL and UKE-1 cells after 6 days of ruxolitinib (3 and 15 µM, respectively). Quantification (H) and representative images (I). Error bars represent mean of n = 2 (HEL) and n = 3 (UKE-1) biological replicates ± SD. J Proliferation curves of HEL cells expressing Empty, NrasQ61K, JAK2V617F or NrasQ61K and JAK2V617F vectors. Error bars represent mean ± SD of n = 10 (day 0), n = 8 (days 3, 6), n = 4 (day 9) biological replicates. Statistical significance using two-tailed Welch’s t-test (A, F–H, J). P-values are reported in the figure. Source data provided as a Source Data file.

References

    1. Labrie, M., Brugge, J. S., Mills, G. B. & Zervantonakis, I. K. Therapy resistance: opportunities created by adaptive responses to targeted therapies in cancer. Nat. Rev. Cancer22, 323–339 (2022). - PMC - PubMed
    1. Shah, N. P. et al. Multiple BCR-ABL kinase domain mutations confer polyclonal resistance to the tyrosine kinase inhibitor imatinib (STI571) in chronic phase and blast crisis chronic myeloid leukemia. Cancer Cell2, 117–125 (2002). - PubMed
    1. McMahon, C. M. et al. Clonal selection with RAS pathway activation mediates secondary clinical resistance to selective FLT3 inhibition in acute myeloid leukemia. Cancer Discov.9, 1050–1063 (2019). - PMC - PubMed
    1. Zhang, H. et al. Clinical resistance to crenolanib in acute myeloid leukemia due to diverse molecular mechanisms. Nat. Commun.10, 244 (2019). - PMC - PubMed
    1. Wagle, N. et al. Dissecting therapeutic resistance to RAF inhibition in melanoma by tumor genomic profiling. J. Clin. Oncol.29, 3085–3096 (2011). - PMC - PubMed

MeSH terms

LinkOut - more resources