. 2025 Jul 7;16(1):6238.
doi: 10.1038/s41467-025-61302-2.

Protozoal populations drive system-wide variation in the rumen microbiome

Affiliations

Protozoal populations drive system-wide variation in the rumen microbiome

Carl M Kobel et al. Nat Commun. .

Abstract

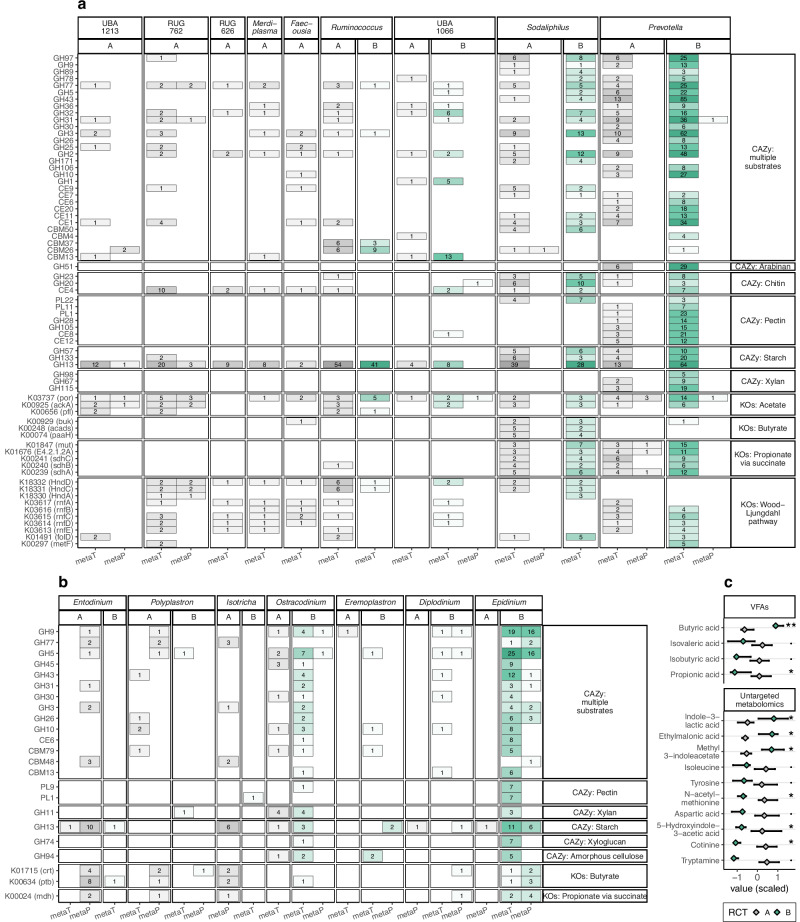
While rapid progress has been made to characterize the bacterial and archaeal populations of the rumen microbiome, insight into how they interact with keystone protozoal species remains elusive. Here, we reveal two distinct system-wide rumen community types (RCT-A and RCT-B) that are not strongly associated with host phenotype nor genotype but instead linked to protozoal community patterns. We leveraged a series of multi-omic datasets to show that the dominant Epidinium spp. in animals with RCT-B employ a plethora of fiber-degrading enzymes that present enriched Prevotella spp. a favorable carbon landscape to forage upon. Conversely, animals with RCT-A, dominated by genera Isotricha and Entodinium, harbor a more even distribution of fiber, protein, and amino acid metabolizers, reflected by higher detection of metabolites from both protozoal and bacterial activity. Our results indicate that microbiome variation across key protozoal and bacterial populations is interlinked, which should act as an important consideration for future development of microbiome-based technologies.


Conflict of interest statement

Competing interests: Authors P.B.P., G.W.T., S.J.M. and A.L. have stock and/or equity interests in Bovotica Pty Ltd. R.D.W. and M.T.S. are employed at Cmbio, which provides consulting and sequencing services. The remaining authors declare no competing interests.

Figures

Fig. 1
Fig. 1. Experimental design of the animal trial and microbiome analyses.
a Animal trial setup. A total of 80 steers across two breeds (Aberdeen-Angus cross and Luing) were enrolled of which 71 completed the 3-6 month study period that culminated in their slaughter. Key performance traits such as average daily gain (ADG), dry matter intake (DMI), feed conversion ratio (FCR) and methane yield (g/kg DMI) were measured for all animals and rumen samples periodically collected across the duration of the trial. The rumen prokaryote community structure was determined using 16S rRNA gene analysis for all 71 animals at slaughter. b Multi-omic sampling and analysis design for a subset of 24 animals, selected on the widest recorded level of natural methane yield variation. At slaughter, three sample locations were collected: Rumen digesta, rumen wall tissue, and liver. Samples were characterized on several molecular layers: Genomes, transcripts, proteins, untargeted metabolomics. For a further subset of 6 animals, metagenomes, metatranscriptomes and metabolomes were analyzed across 5 temporal sampling points collected during the experimental period using nasogastric tubing. Temporal samples were collected prior to the adaptation phase, before and after the performance test as well as immediately after leaving the respiration chambers. c Key performance traits and other animal production metrics that were determined for all enrolled animals. IQR: interquartile range. Significant P values (Welch two-sample t-test; two-sided, without multiple comparison correction) are given in bold. Created in BioRender. Aho, V. (https://BioRender.com/pqc6vo3).
Fig. 2
Fig. 2. Rumen microbiome analyses showing two distinct groups, labeled Rumen Community Type (RCT) -A and -B.
a, b Principal Coordinates Analysis of robust Aitchison distances of (a) 16S rRNA gene sequence data (n = 71), showing two optimal clusters from Dirichlet Multinomial Mixtures; b metagenomic data (n = 24). cf Principal Component Analysis of microbiome-derived c metatranscriptomic, d metaproteomic, and e metabolomic data as well as f host-omic data, showing the first Principal Component (PC) with p < 0.1 (two-sided t-test, no multiple comparison correction) between clusters for each data type. Box hinges: 1st and 3rd quartiles, whiskers: hinge to highest and lowest values within 1.5*IQR of hinge. g Taxonomic classifications of features (transcripts or proteins) with the strongest contributions (i.e., loadings) to PC1 in digesta metatranscriptomics and metaproteomics, grouped by association with RCT-A (positive) or RCT-B (negative), showing top 100 features for each omic and RCT; “other” summarizes taxa with only one feature in the top 100. Data for this figure are available in Supplementary Data 3.
Fig. 3
Fig. 3. Differential abundances of taxa across omic approaches.
a, b Summaries of differential abundance comparisons between Rumen Community Types (RCTs). Numbers indicate taxa with p < 0.05 (out of total n of taxa). metaG: metagenomic relative abundances (n = 24, Wilcoxon rank-sum tests), metaT: metatranscriptome count data (n = 24, DESeq2), metaP: metaproteome label-free quantification (LFQ) intensities (n = 22, Wilcoxon rank-sum tests). All tests were two-sided and multiple comparison corrected with Benjamini-Hochberg false discovery rate. a Metagenome-assembled genomes (MAGs) of bacteria and archaea, showing genera with differentially abundant MAGs supported by at least two omic analyses in the same direction. b Single-amplified genomes (SAGs) of protozoa, showing species with at least two differentially abundant SAGs regardless of direction. c, d Abundances of protozoal species from (b). Diamonds: medians, whiskers: IQR. c Metatranscriptomic data (variance stabilizing transformed (VST) counts; n = 24), d Metaproteomic data (sums of LFQ intensities; n = 22). Data for this figure are available in Supplementary Data 4.
Fig. 4
Fig. 4. Functional differences between rumen community types.
a, b Summaries of KEGG Orthologs (KOs) in pathways of interest (based on) and CAZymes in (a) bacterial and (b) protozoal genera of interest (based on Fig. 2g). CAZymes and KOs were chosen by selecting the 10 pathways or substrates (right-side labels) including the largest amount of features with p < 0.1 between RCTs, then trimming the list to CAZymes and KOs (y-axis labels) detected as differentially abundant at least 5 times across each row. metaT: metatranscriptomics (n = 24; DESeq2), metaP: metaproteomics (n = 22; Wilcoxon rank-sum tests). “CAZy: multiple substrates” contains CAZymes that may act upon various linkages and/or substrates. c. Metabolomic comparisons: volatile fatty acids (VFAs; n = 21) and metabolites from untargeted metabolomics (annotation level 1 or 2a; n = 24) with p < 0.1 (Wilcoxon rank-sum tests). Diamonds: medians, whiskers: IQR. ** p < 0.01, *: p < 0.05, ·: 0.1 > p > 0.05. All tests (ac) were two-sided and multiple comparison corrected with Benjamini-Hochberg false discovery rate. Data for this figure are available in Supplementary Data 5.
Fig. 5
Fig. 5. Metabolic predictions from major populations strongly featured in RCT-A and -B animals that are predicted to influence rumen function.
a Epidinium cattanei, the protozoal species most strongly associated with RCT-B, predicted to engage a broad range of CAZymes to degrade plant material. Given the size and activity of E. cattanei their fiber-degrading metabolism is predicted to impact rumen structure and function of RCT-B animals, which was supported via Microarray Polymer Profiling (MAPP) of plant fibers. MAPP inset: n = 24; diamonds: medians, whiskers: IQR; ** p < 0.01, *: p < 0.05 (two-sided Wilcoxon rank-sum tests without multiple comparison correction); data for this plot are available in Supplementary Data 5e. b RUG762 (Acutalibacteraceae), strongly associated with RCT-A, highlighting sugar fermentation, amino acid (red boxes) metabolism and a partial Wood-Ljungdahl Pathway, supported by associated energy conservation machinery such as the electron-bifurcating hydrogenase (HndABCD, [FeFe] group A), ferredoxin:NAD-oxidoreductase (Rnf) complex, and components of a FoF1 ATP synthase. Bold text: differentially abundant metabolites from Fig. 4c. Created in BioRender. Aho, V. (https://BioRender.com/w9cdcqz).

References

    1. Andersen, T. O. et al. Metabolic influence of core ciliates within the rumen microbiome. ISME J.17, 1128–1140 (2023). - PMC - PubMed
    1. Li, Z. et al. Genomic insights into the phylogeny and biomass-degrading enzymes of rumen ciliates. ISME J.16, 2775–2787 (2022). - PMC - PubMed
    1. Seshadri, R. et al. Cultivation and sequencing of rumen microbiome members from the Hungate1000 Collection. Nat. Biotechnol.36, 359–367 (2018). - PMC - PubMed
    1. Beauchemin, K. A., Ungerfeld, E. M., Eckard, R. J. & Wang, M. Review: Fifty years of research on rumen methanogenesis: lessons learned and future challenges for mitigation. Animal14, s2–s16 (2020). - PubMed
    1. Storm, A. C., Kristensen, N. B. & Hanigan, M. D. A model of ruminal volatile fatty acid absorption kinetics and rumen epithelial blood flow in lactating Holstein cows. J. Dairy Sci.95, 2919–2934 (2012). - PubMed

LinkOut - more resources