. 2025 Jul 7;13(1):69.
doi: 10.1038/s41413-025-00444-x.

Single-cell transcriptomic analysis identifies systemic immunosuppressive myeloid cells and local monocytes/macrophages as key regulators in polytrauma-induced immune dysregulation

Affiliations

Single-cell transcriptomic analysis identifies systemic immunosuppressive myeloid cells and local monocytes/macrophages as key regulators in polytrauma-induced immune dysregulation

Drishti Maniar et al. Bone Res. .

Abstract

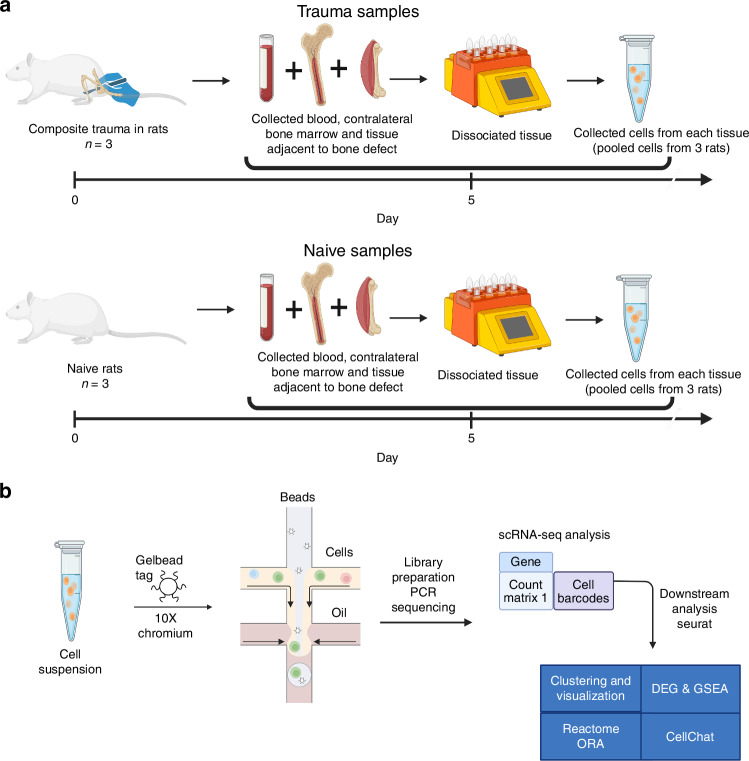
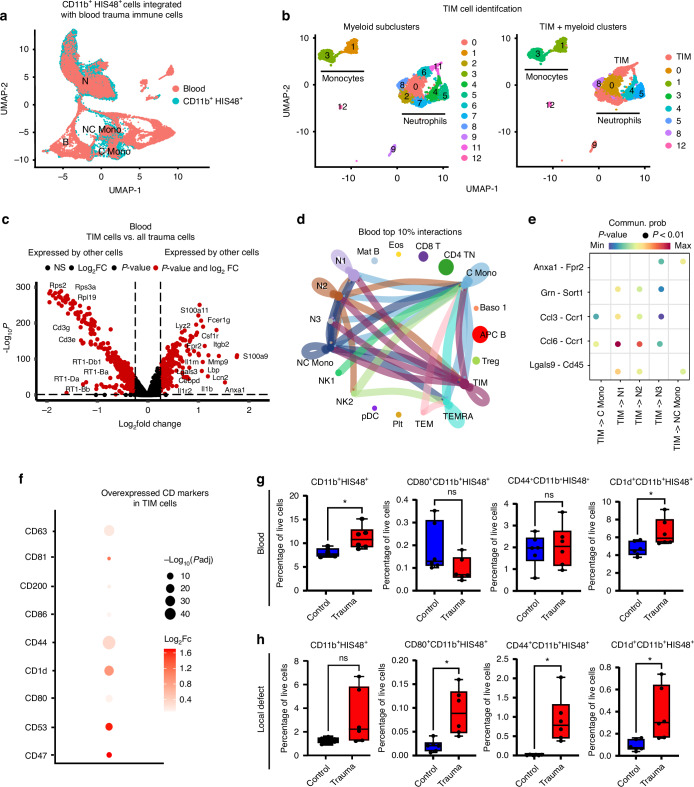
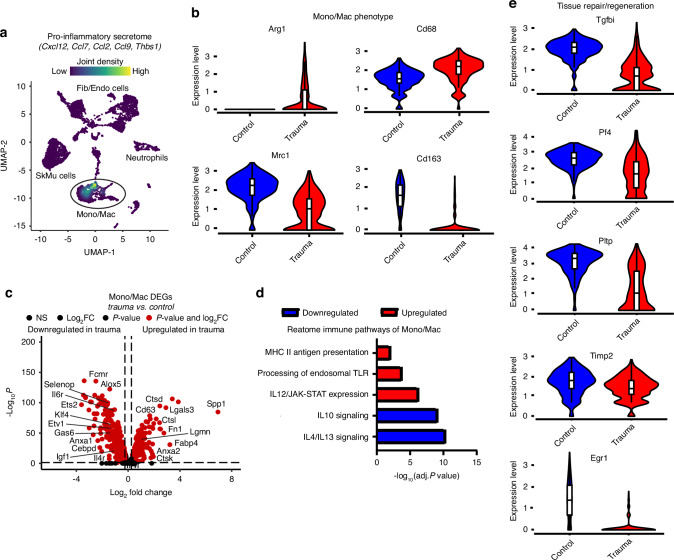
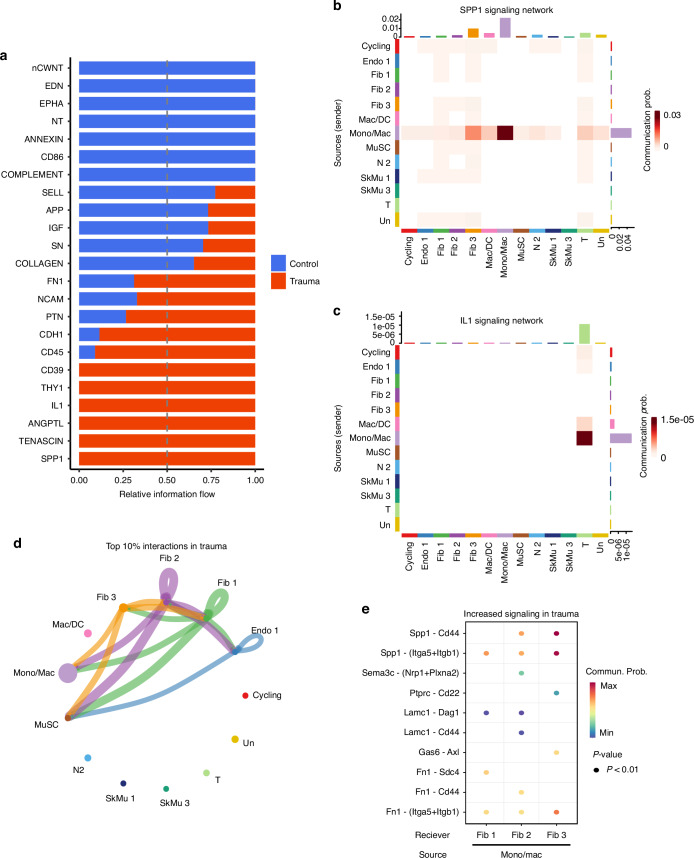
Polytrauma with significant bone and volumetric muscle loss presents substantial clinical challenges. Although immune responses significantly influence fracture healing post-polytrauma, the cellular and molecular underpinnings of polytrauma-induced immune dysregulation require further investigation. While previous studies examined either injury site tissue or systemic tissue (peripheral blood), our study uniquely investigated both systemic and local immune cells at the same time to better understand polytrauma-induced immune dysregulation and associated impaired bone healing. Using single-cell RNA sequencing (scRNA-seq) in a rat polytrauma model, we analyzed blood, bone marrow, and the local defect soft tissue to identify potential cellular and molecular targets involved in immune dysregulation. We identified a trauma-associated immunosuppressive myeloid (TIM) cell population that drives systemic immune dysregulation, immunosuppression, and potentially impaired bone healing. We found CD1d as a global marker for TIM cells in polytrauma. In the local defect tissue, we observed Spp1+ monocytes/macrophages mediating inflammatory, fibrotic, and impaired adaptive immune responses. Finally, our findings highlighted increased signaling via Anxa1-Fpr2 and Spp1-Cd44 axes. This comprehensive analysis enhances our understanding of immune dysregulation-mediated nonunion following traumatic injury and provides biomarkers that could function as treatment targets.


Conflict of interest statement

Competing interests: The authors declare no competing interests.

Figures

Fig. 1
Fig. 1
Experimental timeline of tissue collection from a rat polytrauma model and analytical overview of the single-cell RNA sequencing pipeline. a Polytrauma injuries were induced in three rats, and tissue collection was carried out on Day 5 post-injury. The collected tissues included blood, bone marrow, and the local defect tissue. Additionally, tissues from naïve animals with no injury were collected to serve as the control group. Following tissue collection, single cells were dissociated from each sample, and cells from the same tissue and condition were pooled for sequencing analysis. b The single-cell suspensions were tagged with DNA barcodes and processed using 10X Chromium Protocols. Subsequently, cDNA libraries were prepared by reverse transcription, PCR amplification, and sequencing. Alignment was performed using Cell Ranger, followed by gene matrix processing in R 4.2.2 with Seurat for clustering, visualization, and differential expression gene (DEG) analysis. Pathway analysis and post-DEG analysis were conducted using Reactome and fgsea packages. Ligand-receptor analysis was performed using CellChat
Fig. 2
Fig. 2
Single-cell RNA sequencing reveals expanded neutrophil, monocyte, and macrophage populations following polytrauma. Gene expression matrices from control and trauma groups were integrated and clustered via UMAP. Cell types were assigned based on canonical marker expression. a Blood UMAP identified innate and adaptive immune cell subsets. b Blood cell type percentages were compared across groups. c Bone marrow UMAP showed myeloid progenitors and B cell populations. d Bone marrow cell type percentages were visualized. e Local defect tissue UMAP revealed predominant stromal and immune cell populations. f Local defect tissue cell type percentages were compared. P-values were calculated by chi-squared test. ****P < 0.000 1, *P < 0.05; bar chart pairs without * were not significant. UMAPs were generated in Seurat v4; percentages plotted with Prism. N Neutrophils, Baso Basophils, Eos Eosinophils, C Mono Classical Monocytes, NC Mono Non-Classical Monocytes, pDC Plasmacytoid DCs, APC B Antigen-Presenting B Cells, Mat B Mature B Cells, Plasma Plasma Cells, CD4 TN Naive CD4 T Cells, CD8 T CD8 T Cells, TEMRA Effector Memory RA + CD8 T Cells, TEM Effector Memory CD8 T Cells, Treg Regulatory T Cells, NK Natural Killer Cells, Plt Platelets, M/ProM Myelocytes/Pro-Myelocytes, MetaM Metamyelocytes, PreN Pre-Neutrophils, Mac Macrophages, ProB Pro-B Cells, PreB Pre-B Cells, B B Cells, T T Cells, MK Megakaryocytes, Int Ery Intermediate Erythrocytes, Ery Erythrocytes, Mono/Mac Monocytes/Macrophages, Mac/DC Macrophages/Dendritic Cells, Fib Fibroblasts, Endo Endothelial Cells, SkMu Skeletal Muscle Cells, MuSC Muscle Stem Cells, SmMu Smooth Muscle Cells, Cycling Cycling Cells, Un Undetermined Cells
Fig. 3
Fig. 3
Systemic and local increase of CD1d+ TIM Cells and local increase in CD80+ and CD44+ TIM Cells implicate their role in polytrauma-induced immunosuppression. a Isolated CD11b+HIS48+ cells were integrated with blood immune cells to identify myeloid clusters with similar transcriptomic profiles to those of CD11b+HIS48+ cells as shown in the UMAP projections. b Clusters with high density expression of multiple of these immunosuppressive genes were identified as TIM cells. c DEGs of TIM cells compared to all polytrauma immune cells to identify TIM unique markers. The –Log10 (P values) indicates the level of significance of each gene while Log2 fold change represents the difference between the levels of expression for each gene between the polytrauma and control groups (baseline). d Chord diagrams show the most frequent ligand-receptor interactions where TIM cells in blood act as the signal source for myeloid cells. e Dot plots showing ligand-receptor interactions between TIM and other myeloid cells. f Cluster of differentiation (Cd) genes expressed by TIM cells. g Frequency of peripheral blood CD11b+HIS48+ or CD11b+HIS48+ cells expressing either TIM marker CD80, CD44, or CD1d. h Frequency of local defect CD11b+HIS48+ cells or CD11b+HIS48+ cells expressing either TIM marker CD80, CD44, or CD1d. Significance was determine using unpaired t-test or non-parametric Mann–Whitney test. Biological replicates n = 6, ****P < 0.000 1, ***P < 0.001, **P < 0.01, *P < 0.05
Fig. 4
Fig. 4
Mono/Mac cells exhibit pro-inflammatory and anti-reparative transcriptional responses in polytrauma. a Feature plot illustrating the expression of pro-inflammatory secretome genes within the Mono/Mac cluster. b Violin plots comparing the expression levels of Arg1, Cd68, Mrc1 (CD206), and Cd163 in the Mono/Mac cluster between control and polytrauma condition. c Differentially expressed genes (DEGs) in Mono/Mac cells, showing upregulated and downregulated genes in polytrauma compared to controls. The –Log10 (P-value) indicates the statistical significance of each gene, while Log2 fold change represents the magnitude of expression difference between conditions. d Over-representation analysis (ORA) of the top 200 upregulated and downregulated Mono/Mac DEGs identified significant immune pathways. Red represents upregulated pathways and blue downregulated pathways. Pathways were considered significant if their P-value was <0.01 and their false discovery rate (FDR) was <0.05. e Violin plots comparing the expression of genes associated with tissue repair and regeneration (Tgfbi, Pf4, Pltp, Egr1, Timp2) in the Mono/Mac cluster between control and polytrauma condition
Fig. 5
Fig. 5
Mono/Mac cells drive inflammatory and fibrotic signaling via Spp1 networks in polytrauma. a Differential analysis identified key inflammatory pathways enriched in polytrauma, such as Spp1 and IL-1. Relative information flow, measured on a scale of 0 to 1, quantifies the signaling activity of each pathway, with higher values indicating greater activity. Mono/Mac clusters were shown to play prominent roles in the b Spp1 and c IL-1 signaling networks. d The top 10% of predicted cell-cell interactions, as determined by CellChat analysis, revealed increased interactions between Mono/Mac cells and fibroblasts. e Dot plot highlighting significant interactions upregulated in polytrauma, such as Spp1-Cd44, Spp1-Itga5+Itgb1, and Fn1-Itga5+Itgb1, from Mono/Mac cells to fibroblasts, as determined by CellChat
Fig. 6
Fig. 6
Cross-tissue analysis of TIM and Mono/Mac Cells reveal key biological differences across tissue compartments. a Integration and clustering of gene matrices from all tissues and conditions using uniform manifold approximation projection (UMAP). Clusters were identified using known marker gene expression, consistent with Fig. 2. b Cell type percentages across blood, bone marrow and local defect tissue in control and polytrauma conditions determine using all-tissue integrated dataset. P-values determined by chi-squared test of proportions. ****P < 0.000 1, *P < 0.05. Unmarked bars indicate non-significant differences. GSEA-identified global biological pathways differentially regulated in TIM cells (polytrauma vs. control) within (c) blood, (d) bone marrow and (e) local defect tissue. GSEA-identified global biological pathways differentially regulated in Mono/Mac cells (polytrauma vs. control) within (f) bone marrow and (g) local defect tissue. Red boxes highlight pathways discussed in the main text for TIM cells and Mono/Mac cells and their respective tissues. The Net Enrichment Score (NES) and p-value assessed the degree of gene set over-expression or under-expression in trauma compared to the control. A positive NES indicated upregulation, while a negative NES indicated downregulation
Fig. 7
Fig. 7
TIM and Mono/Mac cells mediate post-polytrauma communication via Anxa1-Fpr2 and Spp1-Cd44 pathways, respectively. a Top 15 hub genes from differentially expressed genes in polytrauma using all-tissue integrated dataset. b Dot plots visualize polytrauma-induced cell signaling strength. c Chord diagrams of differential immune cell interactions in polytrauma versus control condition. d Chord diagrams of differential interactions between immune and tissue-resident cells (red: upregulated, blue: downregulated in polytrauma). e Most significant ligand-receptor interactions with increased communication probability in polytrauma for TIM cell-initiated signaling. f Most significant ligand-receptor interactions with increased communication probability in polytrauma for Mono/Mac cell-initiated signaling

References

    1. Thompson, K. B., Krispinsky, L. T. & Stark, R. J. Late immune consequences of combat trauma: a review of trauma-related immune dysfunction and potential therapies. Mil. Med. Res.6, 11 (2019). - PMC - PubMed
    1. Mukhametov, U. et al. Immunologic response in patients with polytrauma. Noncoding RNA Res.8, 8–17 (2023). - PMC - PubMed
    1. Huber-Lang, M., Lambris, J. D. & Ward, P. A. Innate immune responses to trauma. Nat. Immunol.19, 327–341 (2018). - PMC - PubMed
    1. Ruehle, M. A. et al. Effects of BMP‐2 dose and delivery of microvascular fragments on healing of bone defects with concomitant volumetric muscle loss. J. Orthop. Res.37, 553–561 (2019). - PubMed
    1. Vantucci, C. E. et al. Systemic immune modulation alters local bone regeneration in a delayed treatment composite model of non-union extremity trauma. Front. Surg.9, 934773 (2022). - PMC - PubMed

LinkOut - more resources