. 2025 Jul 7;16(1):6262.
doi: 10.1038/s41467-025-60687-4.

RNA-binding protein YebC enhances translation of proline-rich amino acid stretches in bacteria

Affiliations

RNA-binding protein YebC enhances translation of proline-rich amino acid stretches in bacteria

Dmitriy Ignatov et al. Nat Commun. .

Abstract

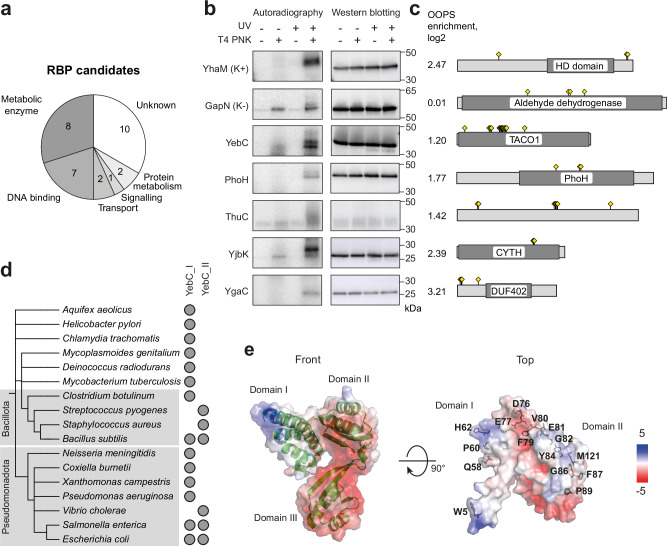
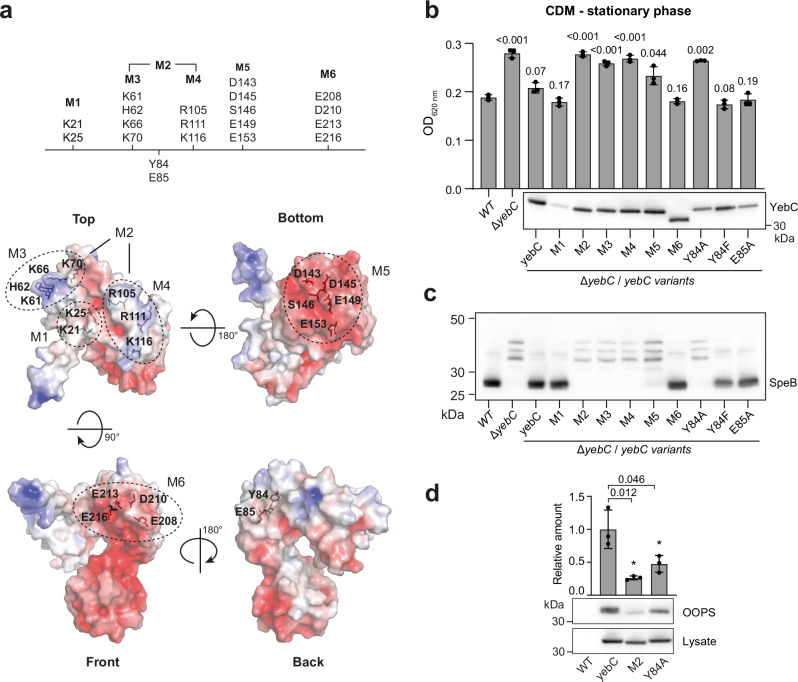
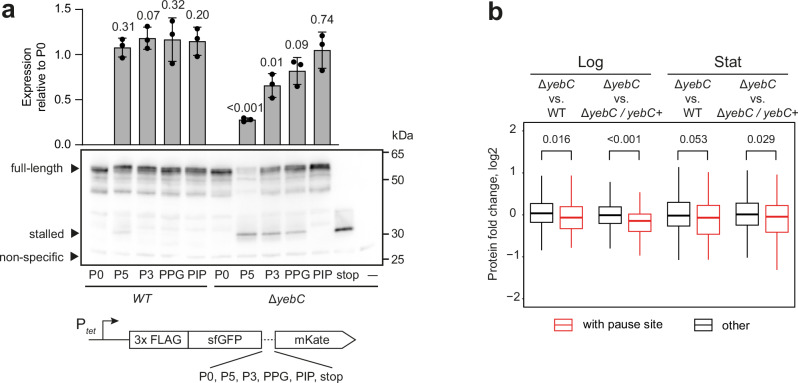
The ribosome employs a set of highly conserved translation factors to efficiently synthesise proteins. Some translation factors interact with the ribosome in a transient manner and are thus challenging to identify. However, proteins involved in translation can be specifically identified by their interaction with ribosomal RNAs. Using a combination of proteomics approaches, we identified 30 previously uncharacterized RNA-binding proteins in the pathogenic bacterium Streptococcus pyogenes. One of these, a widely conserved protein YebC, was shown to transiently interact with 23S rRNA near the peptidyl-transferase centre. Deletion of yebC moderately affected the physiology and virulence of S. pyogenes. We performed ribosome profiling and detected increased pausing at proline-rich amino acid motifs in the absence of functional YebC. Further experiments in S. pyogenes and Salmonella Typhimurium and using an in vitro translation system suggested that YebC is a translation factor required for efficient translation of proteins with proline-rich motifs.


Conflict of interest statement

Competing interests: The authors declare no competing interests.

Figures

Fig. 1
Fig. 1. Identification of RBPs in S. pyogenes.
a Workflow for the characterisation of proteins that cross-link with RNA. After UV 254 nm cross-linking, the protein-RNA complexes were separated from proteins and RNA by acid guanidinium thiocyanate-phenol-chloroform extraction. The cross-linked protein-RNA complexes were further analysed by OOPS or RBS-ID approaches. b Overlap between annotated RBPs, proteins with statistically significant OOPS enrichment and proteins with RNA cross-linking sites identified by RBS-ID. c OOPS enrichment and the presence of RNA cross-linking sites for different functional groups of the annotated RBPs. The OOPS enrichment values for proteins in each manually curated category are presented in a bee swarm plot. The proteins whose OOPS enrichment is not statistically significant are indicated by black dots. The bar plot shows the number of proteins with identified RNA cross-linking sites (coloured bars) and without them (white bars) for each category.
Fig. 2
Fig. 2. RBP candidates in S. pyogenes.
a Manually curated functional categories of RBP candidates. b Detection of cross-linked protein-RNA complexes. The strains containing the 3x FLAG tagged potential RBPs or the control proteins YhaM and GapN were UV irradiated. The protein-RNA complexes were immunoprecipitated, radioactively labelled with T4 PNK, separated by gel electrophoresis and transferred to a membrane. Radioactive signals were detected by phosphor imaging. Western blotting with an anti-FLAG antibody served as a control for successful immunoprecipitation. The experiment was performed in two biological replicates with similar results. c Description of proteins in panel b. OOPS enrichment, annotated domains and location of RNA cross-linking sites are shown. d Presence of YebC_I and YebC_II subtypes in different bacteria. e Modelled structure of S. pyogenes YebC. The cartoon structure of the protein and the predicted surface electrostatic potential are shown. The identified RNA cross-linking sites are indicated in the top view of the protein.
Fig. 3
Fig. 3. Phenotype of yebC deletion in S. pyogenes.
a Growth curves of the WT, ΔyebC and ΔyebC/yebC+ strains in THY, C medium and CDM. Data represent the mean ± standard deviation (SD) of three biological replicates. b Expression of SpeB in the reporter strains ΔspeB + Ptet-speB and ΔspeB ΔyebC + Ptet-speB, and in the WT and ΔyebC strains. The strains were grown in THY until the early stationary growth phase, the supernatants were collected and SpeB expression was probed with anti-SpeB antibodies. To induce the tet promoter, 10 ng/mL anhydrotetracycline was added to the cultures of the reporter strains. In the culture supernatant of the WT strain, SpeB was mostly present as a mature 28 kDa enzyme, while in the supernatants of the yebC mutants, only the bands corresponding to the 40 kDa zymogen and several intermediates were detected. The experiment was performed in three biological replicates with similar results. c Activity of speB promoter in the WT and ΔyebC strains. The reporter strains expressing sfGFP under the control of speB or tet promoters were grown in THY with 10 ng/mL anhydrotetracycline until the early stationary growth phase. The cells were lysed and sfGFP (27 kDa) expression was analysed by western blotting. The Ponceau staining of the membrane demonstrates equal sample loading. The experiment was performed in three biological replicates with similar results. d Intracellular survival of S. pyogenes WT, ΔyebC and ΔyebC/yebC+ in primary human macrophages at 2 h, 3 h and 4 h post-infection. Data represent the mean ± SD of three (2 h) or four (3 and 4 h) biological replicates. Statistical analysis was performed using two-way ANOVA and the p values are indicated.
Fig. 4
Fig. 4. Identification of amino acid residues critical for YebC acivity.
a Amino acid residues for site-directed mutagenesis superimposed on the YebC structure. b Optical density of stationary phase cultures of yebC mutant and complemented strains in CDM. Data represent mean ± SD of three biological replicates. The optical density of cultures of each strain was compared to that of the WT. The statistical significance of the differences was estimated using the two-sided t test and the p values are indicated above the bars. The complemented YebC is tagged with the C-terminal 3x FLAG tag and its expression was measured by western blotting using anti-FLAG antibodies (shown below). c Expression of the SpeB protein in the yebC mutant and complemented strains. The strains were grown overnight in THY, the supernatants were collected and SpeB expression was probed with anti-SpeB antibodies. The experiment was performed in two biological replicates with similar results. d The relative amounts of YebC and its mutants, M2 and Y84A, in the OOPS protein fraction enriched with RBPs. The ΔyebC strains complemented with either yebC::3xFLAG or its mutant versions were grown in CDM until the mid-logarithmic phase and UV irradiated. OOPS was performed and the amount of YebC in the lysate and the fraction enriched with RBPs was probed by western blotting using anti-FLAG antibodies. The relative amounts of YebC versions were measured by densitometry and normalised to the average amount of the wild-type. Data represent the mean ± SD of three biological replicates. The statistical significance of difference in amounts of the WT and mutant YebC versions was estimated using the two-sided t test and the p values are indicated above the bars.
Fig. 5
Fig. 5. Interaction of YebC with the ribosome.
a Distribution of the nucleotides cross-linked to YebC in the S. pyogenes transcriptome. Genomic regions (30 nt in length) showing an increased number of cross-linked nucleotides relative to neighbouring regions were determined. The region with the highest number of cross-linked nucleotides (top CL region) for each library is highlighted on the right. b iCLIP read coverage of 23S rRNA in yebC::3xFLAG UV+ and control samples. Coverage was normalised to the sequencing depth of the libraries and presented as RPM values. The top cross-linking region in yebC::3xFLAG UV+ encompassing nucleotides 2440 to 2470 is marked in green on the 23S rRNA. c Position of the cross-linking region in domain V of 23S rRNA. The nucleotides with increased iCLIP read coverage are circled in blue and the cross-linked nucleotides are circled in red. The coordinates of nucleotides in S. pyogenes are shown in black and the coordinates of the homologous nucleotides in E. coli are shown in grey. d Structure of E. coli ribosome (PDB ID 7K00) with transparent (left) and transverse (right) section of the 50S (grey) to reveal density for helix 89 (blue) with A2450, A2451 and A2452 highlighted in red, P-tRNA (lavender), A-tRNA (green) and 30S (yellow). e Sucrose density gradient ribosome traces of WT, ΔyebC and ΔyebC/yebC+ strains.
Fig. 6
Fig. 6. Ribosome pausing in S. pyogenes yebC mutants.
a Mean pause scores for valS codons 27-66 in the WT and yebC mutant strains. Data represent mean ± SD of three biological replicates. Codons with a statistically significant difference in pause scores between the strains with functional and non-functional YebC are indicated by asterisks. The criteria for estimation of statistical significance are described in Methods. b Logo plot of codons in the vicinity of sites with increased pausing in the yebC mutant strains. The x-axis shows the position of the paused ribosome with the P and A sites indicated. c Motifs enriched in the vicinity of sites with increased pausing in the yebC mutant strains. d Average pausing scores for the codons surrounding PPG, PIP and DIP motifs. The occurrence of these motifs in S. pyogenes mRNAs is indicated.
Fig. 7
Fig. 7. Effect of YebC on translation of proline-rich regions in S. pyogenes.
a Effect of yebC deletion on the polyproline stalling in vivo. The reporter proteins bearing different amino acid sequences between sfGFP and mKate were introduced to the WT and ΔyebC strains under the control of the Ptet promoter. Expression of the reporter was induced in the exponentially growing S. pyogenes cells, and the cells were collected 30 min after induction. Western blotting with anti-FLAG antibodies detected the full-length reporter, the truncated reporter with stop codon and the truncated reporters in the ΔyebC strain. The non-specific band served as a loading control. The amount of the full-length products relative to P0 was measured by densitometry and presented in the barplot as mean ± SD of three biological replicates. The statistical significance of the difference relative to the P0 strain was estimated with the two-sided t test. b Genes with YebC-dependent pausing are expressed at a lower level in the ΔyebC strain. The protein expression in the mid-logarithmic (Log) and stationary (Stat) growth phases was measured by MS proteomics in three biological replicates. The average expression level of each protein in the ΔyebC strain was compared with that in the WT and ΔyebC/yebC+ strains. The fold change differences for proteins with YebC-dependent pause sites (n = 69) and without them (n = 1246) are presented as a boxplot, where the box represents the interquartile range and the median, and the whiskers extend to ×1.5 of the interquartile range. The statistical significance of the difference in protein expression was estimated with the two-sided Mann-Whitney test.
Fig. 8
Fig. 8. Activity of YebC paralogs.
a Effect of YebC paralogs on the polyproline stalling in vitro. The folA mRNA with the indicated mutations served as a template for in vitro translation using the PURE system. The E. coli proteins YeeN, its mutants and YebC were added to the reactions with P5 mRNA. The indicated reactions were then treated with RNase A. The barplot represents the amount of the full-length product in P5, as measured by densitometry and normalised to P0, with values representing the mean ± SD of three independent replicates. A significance of the effect of YebC proteins on the amount of the full-length product was estimated using the two-sided t test. b The growth rates of S. Typhimurium mutants. The calculated growth rates are presented in the barplot as mean ± SD of six biological replicates. c The growth rates of S. Typhimurium mutants upon yebC depletion using CRISPRi. S. Typhimurium WT and Δefp strains were transformed with either a vector expressing dCas9 or a vector expressing both dCas9 and a sgRNA targeting yebC. The cells were grown in LB supplemented with 10 μg/mL chloramphenicol with or without inducers of dCas9 and sgRNA (10 mM arabinose and 100 ng/mL anhydrotetracycline). The calculated growth rates are presented in the barplot as mean ± SD of six biological replicates. The statistical significance of the differences in growth rates was estimated with the two-sided t test.

References

    1. Holmqvist, E. & Vogel, J. RNA-binding proteins in bacteria. Nat. Rev. Microbiol.16, 601–615 (2018). - PubMed
    1. Smirnov, A. et al. Grad-seq guides the discovery of ProQ as a major small RNA-binding protein. Proc. Natl. Acad. Sci. USA113, 11591–11596 (2016). - PMC - PubMed
    1. Shchepachev, V. et al. Defining the RNA interactome by total RNA-associated protein purification. Mol. Syst. Biol.15, e8689 (2019). - PMC - PubMed
    1. Queiroz, R. M. L. et al. Comprehensive identification of RNA-protein interactions in any organism using orthogonal organic phase separation (OOPS). Nat. Biotechnol.37, 169–178 (2019). - PMC - PubMed
    1. Urdaneta, E. C. et al. Purification of cross-linked RNA-protein complexes by phenol-toluol extraction. Nat. Commun.10, 990 (2019). - PMC - PubMed

MeSH terms

LinkOut - more resources