. 2025 Jul 7;16(1):6231.
doi: 10.1038/s41467-025-60975-z.

Nuclear morphometrics coupled with machine learning identifies dynamic states of senescence across age

Affiliations

Nuclear morphometrics coupled with machine learning identifies dynamic states of senescence across age

Sahil A Mapkar et al. Nat Commun. .

Abstract

Cellular senescence is an irreversible state of cell cycle arrest with a complex role in tissue repair, aging, and disease. However, inconsistencies in identifying cellular senescence have led to varying conclusions about their functional significance. We developed a machine learning-based approach that uses nuclear morphometrics to identify senescent cells at single-cell resolution. By applying unsupervised clustering and dimensional reduction techniques, we built a robust pipeline that distinguishes senescent cells in cultured systems, freshly isolated cell populations, and tissue sections. Here we show that this method reveals dynamic, age-associated patterns of senescence in regenerating skeletal muscle and osteoarthritic articular cartilage. Our approach offers a broadly applicable strategy to map and quantify senescent cell states in diverse biological contexts, providing a means to readily assess how this cell fate contributes to tissue remodeling and degeneration across lifespan.


Conflict of interest statement

Competing interests: SAM and MNW are listed as inventors on the US Provisional Patent Application #63/671,334, which pertains to the nuclear morphometric pipeline. The remaining authors declare no competing interests.

Figures

Fig. 1
Fig. 1. Senescent conversion alters nuclear morphology.
A Schematic of the nuclear morphometric pipeline (NMP) developed to identify senescence (Created in BioRender. Mapkar, S. (2025) https://BioRender.com/w2xaf4w). B H2O2 treatment of C2C12 cells induces a senescent phenotype in a dose-dependent manner. MFI – mean fluorescence intensity. n = 3 independent experimental replicates. C Representative FACS histogram for Spider SA-β-Gal staining. The graph quantifies replicates relative to untreated and unstained. Blue – untreated, Red – 300 µM, Orange – 500 µM. n = 3 independent experimental replicates. D SASP assessment by qRT-PCR. n = 4 independent experimental replicates, where each column represents one replicate. Green – increased expression, Orange – decreased expression, White – equivalency to untreated. E Representative images and quantification of the nuclear morphology between treatment groups. Note, image Look-Up Tables (LUTs) and exposure times are equivalent. Scale bar – 50 μm. n = 3 independent experimental replicates. Error bars represent the mean ± standard error of the mean (SEM), and statistical tests were conducted using unpaired two-sided t tests with no adjustments. *p ≤ 0.05, **p < 0.01, ***p < 0.001, ****p < 0.0001. Source data are provided as a Source Data file. Precise p-values are listed in Supplementary Table 2.
Fig. 2
Fig. 2. Nuclear morphometrics define senescence and can be reduced to a unifying score.
A A UMAP of reduced single-cell nuclear morphology with 5 groups resolved by the k-means clustering algorithm. Inserts are representative nuclei from each cluster of H2O2 treated C2C12 cells. Image Look-Up Tables (LUTs) and exposure times are equivalent. Scale bars – 5 μm. B Further reduction creates a one-dimensional senescent “score” correlating with nuclear phenotype and treatment condition. C Orange (senescent) and red (senescent like) clusters exhibit a strong senescence phenotype and are quantified in the bar graph. n = 3 independent experimental replicates. D Quantification of senescent-associated markers in clusters identified as senescent by the NMP. MFI – mean fluorescence intensity; NS – non-senescent; SEN – senescent. n = 3 independent experimental replicates. E Representative UMAPs and a line graph quantifying the decrease in SnCs with increasing senolytic concentration, as detected by the NMP. Gray – untreated, Blue – 300 µM, Green – 500 µM. Violin plots visualize senescent score (y-axis) to demonstrate decrease in the density of low-scoring, morphologically senescent nuclei, as shown inside the red box. Comparisons are made within treatment groups. n = 3 independent experimental replicates. Error bars represent the mean ± standard error of the mean (SEM), and statistical tests were conducted using unpaired two-sided t tests with no adjustments except for (E), which used a two-way ANOVA.*p ≤ 0.05, **p < 0.01, ***p < 0.001. Source data are provided as a Source Data file. Precise p-values are listed in Supplementary Table 2.
Fig. 3
Fig. 3. The NMP is applicable across varying mechanisms of senescence induction.
A,B Quantification of senescence markers following (A) etoposide and (B) doxorubicin treatment of C2C12s. n = 3 independent experimental replicates. C, D Representative images and quantification of nuclear morphometrics of C2C12s treated with (C) etoposide - Etop and (D) doxorubicin - Dox. Note the dosage response to each small molecule inducer. Exposure times and Look-Up Tables (LUTs) are held constant. Scale bar – 200 μm. n = 3 independent experimental replicates. E, F Large UMAPs consisting of reduced single-cell nuclear morphology with 5 groups resolved by the k-means clustering algorithm for (E) etoposide and (F) doxorubicin. Inserts are representative nuclei from each cluster. Scale bars – 20 μm. One-dimensional senescent “score,” in small UMAPs, correlating with nuclear phenotype and treatment condition, shows dose-dependent quantification in violin plots. Orange (senescent) and red (senescent like) clusters exhibit a strong senescence phenotype and are quantified in the horizontal color bar graph. n = 3 independent experimental replicates. Gray bar graphs are the quantification of senescent-associated markers in clusters identified as senescent by the NMP. n = 3 independent experimental replicates. MFI – mean fluorescence intensity. NS – non-senescent; SEN – senescent. Error bars represent the mean ± standard error of the mean (SEM), and statistical tests were conducted using unpaired two-sided t-tests with no adjustments. *p ≤ 0.05, **p < 0.01, ***p < 0.001, ****p < 0.0001. Source data are provided as a Source Data file. Precise p-values are listed in Supplementary Table 2.
Fig. 4
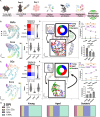
Fig. 4. The NMP identifies a dynamic state of senescence in regenerating skeletal muscle.
A Schematic demonstrating the experimental approach (Created in BioRender. Mapkar, S. (2025) https://BioRender.com/mxe0n7o). BD Fibroadipogenic progenitors - FAPs, EG: Satellite Cells - SCs. B, E Representative UMAPs reducing nuclear phenotypes for the noted experimental conditions and the NMP-derived senescent score. Representative associated heat map displays phenotypic differences at noted days post injury (DPI), Red – increased from uninjured, Blue – decreased from uninjured. The representative associated violin plot visualizes differences in score. C, F Representative UMAPs defining the age-dependent cell representation in the senescent population. Circle plots quantify the relative representation of cells per age in the SnC cluster. Blue – young, Red – aged, Green – geriatric. D, G Line graphs show the age-dependent changes for the noted DPI, and the bar graphs denote those of 3 DPI. Significance is relative to the untreated. n = 3 independent biological replicates per age. Teal – Uninjured, Purple – 3 DPI, Orange – 21 DPI. H Visualization of which cell populations contribute to total senescence during SkM injury at different age groups. Enriched Endothelial Cells – Enr. ECs. Immune Cells – ICs. All UMAP cell numbers from each condition are equivalent. Error bars represent the mean ± standard error of the mean (SEM), and statistical tests were conducted using unpaired two-sided t-tests with no adjustments. **p < 0.01, ***p < 0.001, ****p < 0.0001. Source data are provided as a Source Data file. Precise p-values are listed in Supplementary Table 2.
Fig. 5
Fig. 5. The NMP can effectively identify FAPs with senescent characteristics in vivo in the regenerating muscles of young and geriatric mice.
A, D Representative images of geriatric skeletal muscle (SkM) cross-sections identifying PDGFRα + FAPs, Laminin+ encircled muscle fibers, (A) Ki67 + proliferating cells or (D) γH2A + damage, and DAPI to identify and resolve nuclear morphology. B, E Quantification of (B) proliferating or (E) damaged FAPs relative to young. Violin plots quantify the noted marker per single cell (each dot). MFI – mean fluorescence intensity. n = 3 independent biological replicates per age. C, F UMAPs showing the clustering of single FAPs by the NMP with senescent scores indicated by color (lower scores – purple – are highly senescent cells), and expression level of the noted marker by the size of the circle. Bar graphs quantify the amount of the noted marker in the non-SnC (NS) or SnCs (SEN). n = 3 independent biological replicates per age. Scale bars – 50 μm, inset scale bars – 10 μm. Error bars represent the mean ± standard error of the mean (SEM) and statistical tests were conducted using unpaired two-sided t-tests with no adjustments. *p ≤ 0.05, **p < 0.01, ***p < 0.001. Source data are provided as a Source Data file. Precise p-values are listed in Supplementary Table 2.

References

    1. Tuttle, C. S. L. et al. Cellular senescence and chronological age in various human tissues: A systematic review and meta‐analysis. Aging Cell19, e13083 (2020). - PMC - PubMed
    1. Wang, L., Lankhorst, L. & Bernards, R. Exploiting senescence for the treatment of cancer. Nat. Rev. Cancer22, 340–355 (2022). - PubMed
    1. Coppé, J.-P., Desprez, P.-Y., Krtolica, A. & Campisi, J. The Senescence-Associated Secretory Phenotype: The Dark Side of Tumor Suppression. Pathol. Mech. Dis.5, 99–118 (2010). - PMC - PubMed
    1. Hu, L. et al. Why Senescent Cells Are Resistant to Apoptosis: An Insight for Senolytic Development. Front. Cell Dev. Biol.10, 822816 (2022). - PMC - PubMed
    1. Rhinn, M., Ritschka, B. & Keyes, W. M. Cellular senescence in development, regeneration and disease. Development146, dev151837 (2019). - PubMed

LinkOut - more resources