

Development, verification, and comparison of a risk stratification model to identify potential population benefiting from chemotherapy in non-metastatic male breast cancer
- PMID: 40624063
- PMCID: PMC12234949
- DOI: 10.1038/s41598-025-08440-1
Development, verification, and comparison of a risk stratification model to identify potential population benefiting from chemotherapy in non-metastatic male breast cancer
Abstract
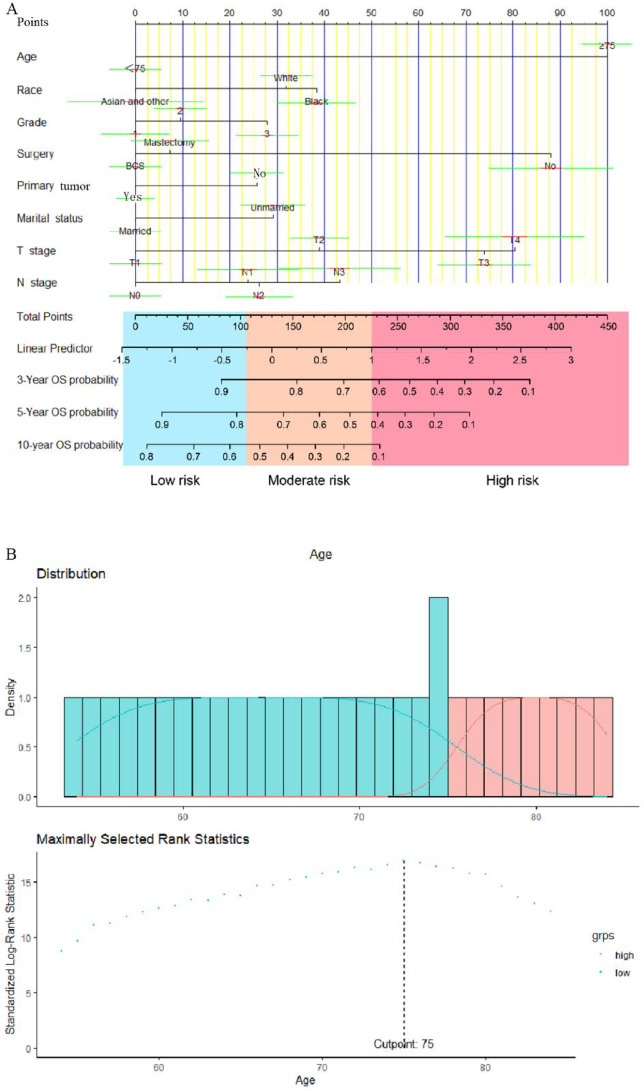
To establish a prognostic stratification nomogram for non-metastatic male breast cancer to determine which patients can benefit from chemotherapy. A population-based study was conducted using data collected from the surveillance, epidemiology, and end results database. Cox proportional hazards analysis identified significant prognostic factors for survival. A prognostic stratification model was developed using R software. Propensity score matching was implemented to balance characteristics between the chemotherapy cohort and the non-chemotherapy cohort. The multivariate analyses indicated that age, race, grade, surgery, primary tumor, marital status, T stage, and N stage were independent prognostic factors for overall survival in non-metastatic metastatic MBC patients who did not receive chemotherapy (all P < 0.05). The C-index was 0.786 (95% CI 0.662-0.870) in the training cohort and 0.763 (95% CI 0.517-0.852) in the validation cohort. The nomogram effectively discriminated between low-risk, moderate-risk, and high-risk groups concerning OS (P < 0.0001). The current study developed the first prognostic stratification nomogram for non-metastatic MBC and identified that patients in the moderate-risk and high-risk groups are more likely to benefit from chemotherapy.
Keywords: Chemotherapy; Male breast cancer; Nomogram; Overall survival; Prognosis; SEER.
© 2025. The Author(s).
Conflict of interest statement
Declarations. Competing interests: The authors declare no competing interests. Ethics statement: This study was approved by the ethics committee of the local hospital (Xijing hospital), and because it was a retrospective study, permission for the exemption of informed consent was obtained.
Figures


Similar articles
-
Identification of Patients with Early-Stage Hepatocellular Carcinoma Benefiting from Neoadjuvant Chemotherapy-A SEER-Based Study.J Gastrointest Cancer. 2025 Jun 29;56(1):144. doi: 10.1007/s12029-025-01264-2. J Gastrointest Cancer. 2025. PMID: 40581673
-
Establishment of a prognostic nomogram and risk stratification system for patients with distant-metastatic hepatocellular carcinoma: A population-based study.Medicine (Baltimore). 2025 Jun 13;104(24):e42834. doi: 10.1097/MD.0000000000042834. Medicine (Baltimore). 2025. PMID: 40527819 Free PMC article.
-
Competing risk and random survival forest models for predicting survival in post-resection elderly stage I-III colorectal cancer patients.Sci Rep. 2025 Jul 7;15(1):24269. doi: 10.1038/s41598-025-05824-1. Sci Rep. 2025. PMID: 40624131 Free PMC article.
-
Cost-effectiveness of using prognostic information to select women with breast cancer for adjuvant systemic therapy.Health Technol Assess. 2006 Sep;10(34):iii-iv, ix-xi, 1-204. doi: 10.3310/hta10340. Health Technol Assess. 2006. PMID: 16959170
-
Impact of residual disease as a prognostic factor for survival in women with advanced epithelial ovarian cancer after primary surgery.Cochrane Database Syst Rev. 2022 Sep 26;9(9):CD015048. doi: 10.1002/14651858.CD015048.pub2. Cochrane Database Syst Rev. 2022. PMID: 36161421 Free PMC article.
References
-
- American Cancer Society. Cancer Facts and Figures 2022 (National Home Office, 2022).
-
- Miao, H. et al. Incidence and outcome of male breast cancer: An international population-based study. J. Clin. Oncol.29(33), 4381–4386 (2011). - PubMed
-
- Li, X. et al. Hormone receptor-positive breast cancer has a worse prognosis in male than in female patients. Clin. Breast Cancer17, 356–366. 10.1016/j.clbc.2017.03.005 (2017). - PubMed
-
- Leone, J. et al. Tumor subtypes and survival in male breast cancer. Breast Cancer Res. Treat.188, 695–702. 10.1007/s10549-021-06182-y (2021). - PubMed
Publication types
MeSH terms
LinkOut - more resources
Full Text Sources
Medical
