

Identification and validation of glucocorticoid receptor and programmed cell death-related genes in spinal cord injury using machine learning
- PMID: 40624156
- PMCID: PMC12234908
- DOI: 10.1038/s41598-025-08060-9
Identification and validation of glucocorticoid receptor and programmed cell death-related genes in spinal cord injury using machine learning
Abstract
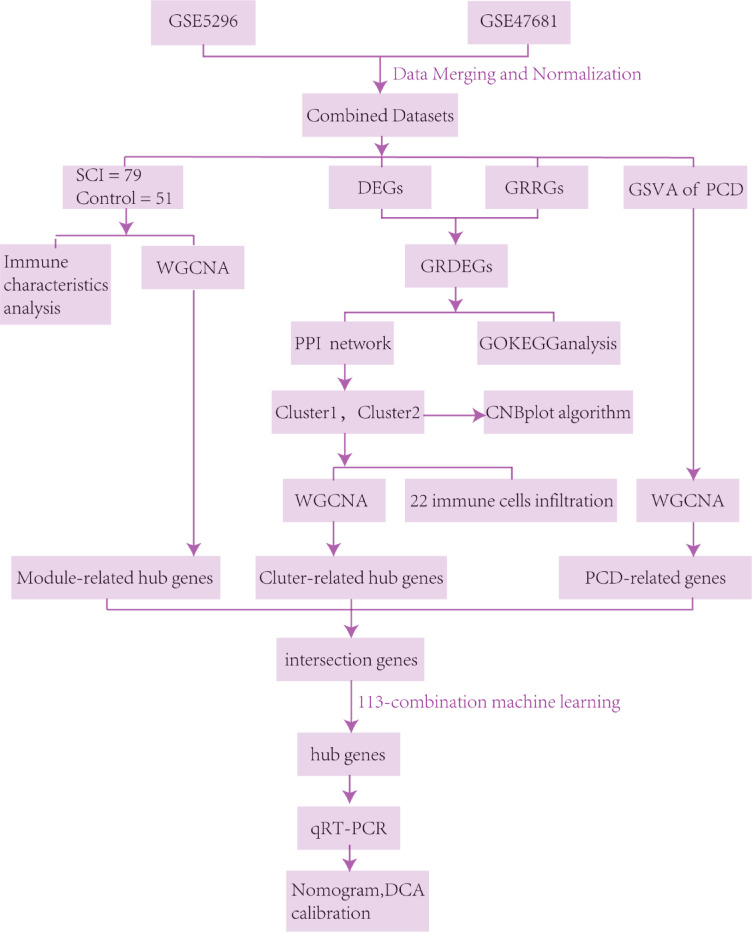
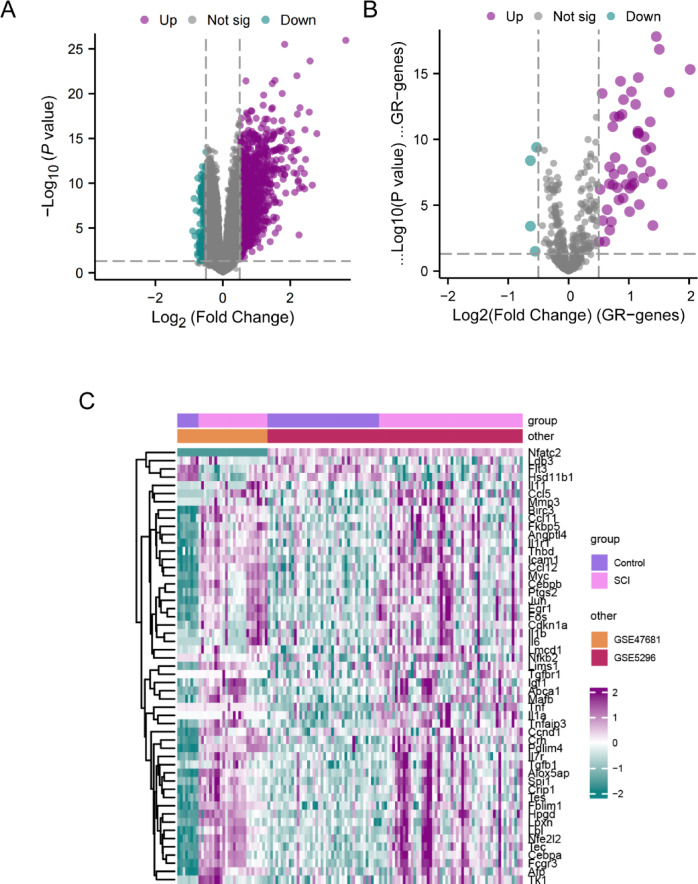
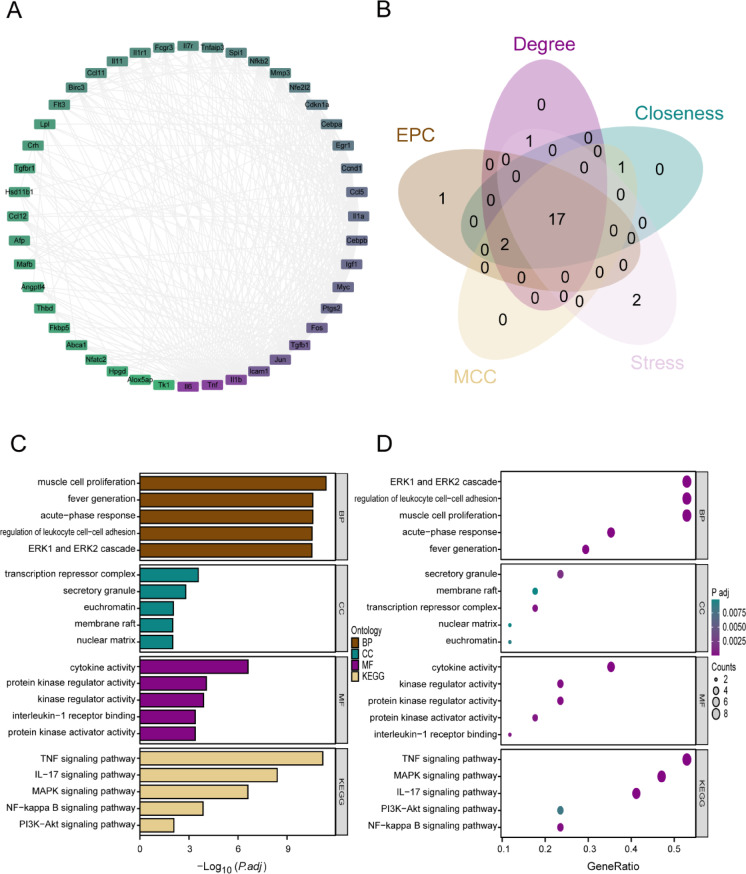
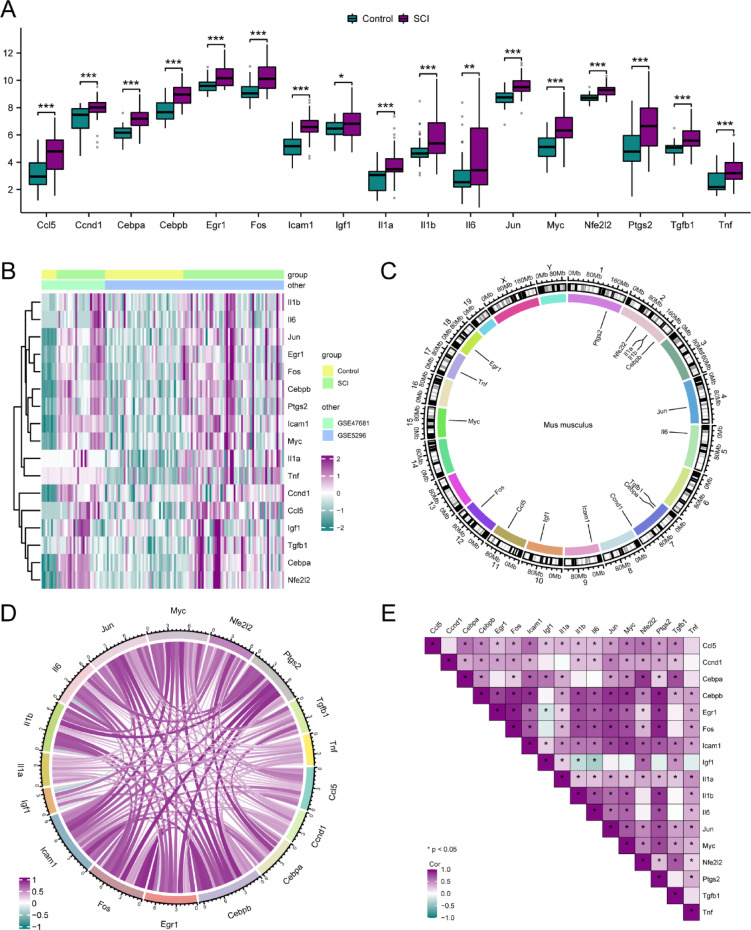
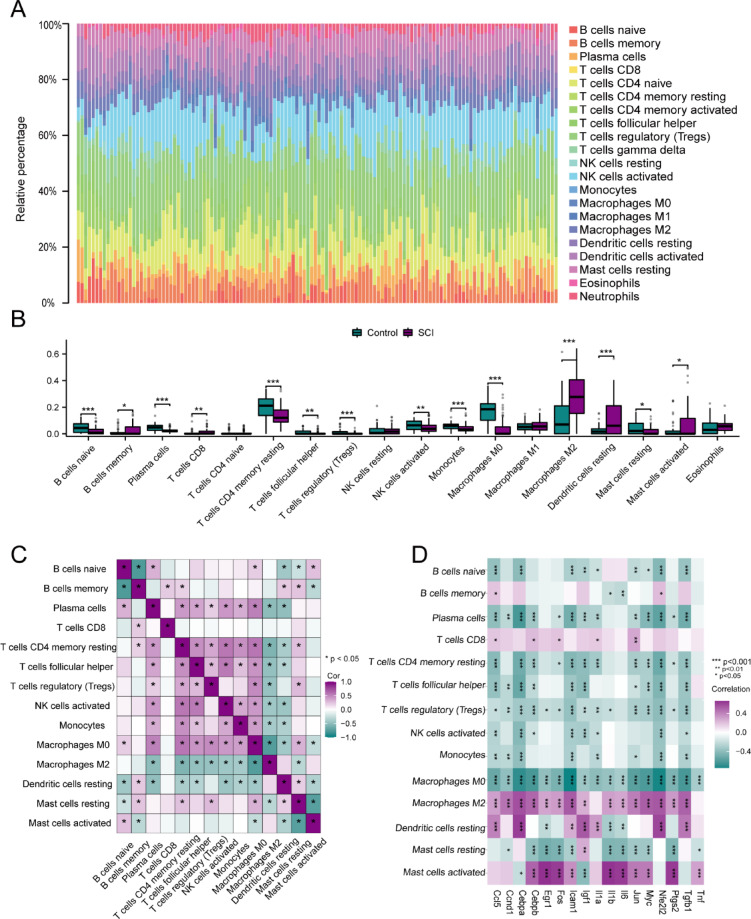
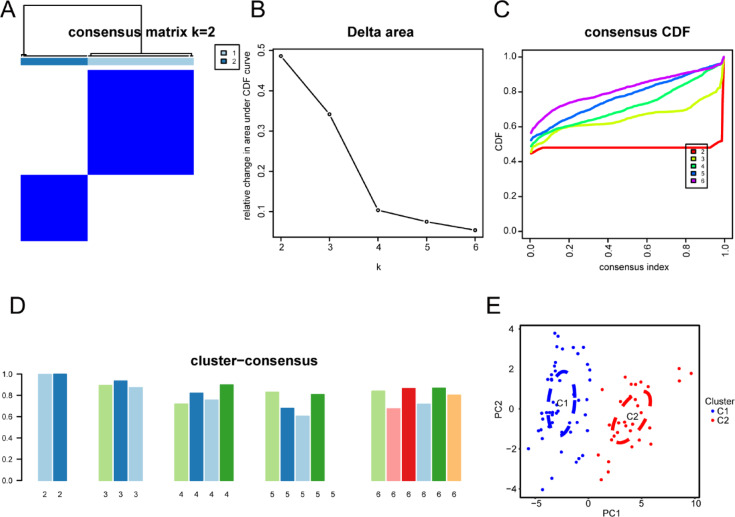
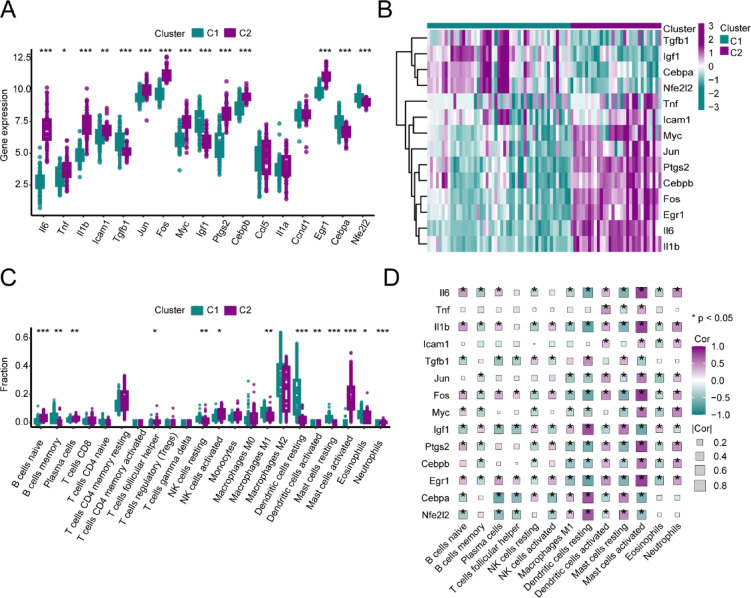
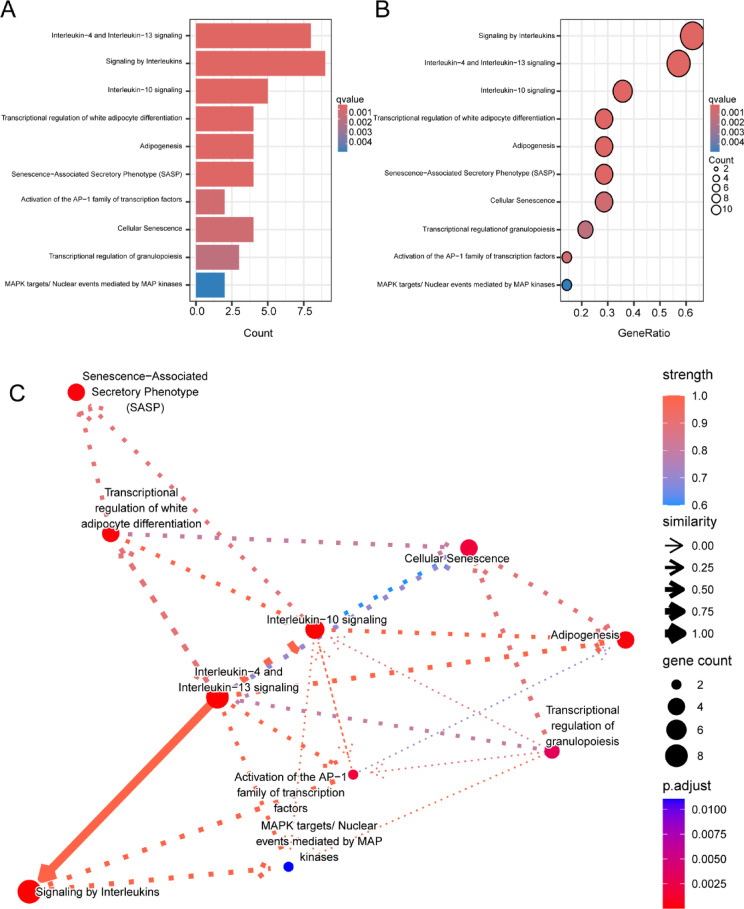
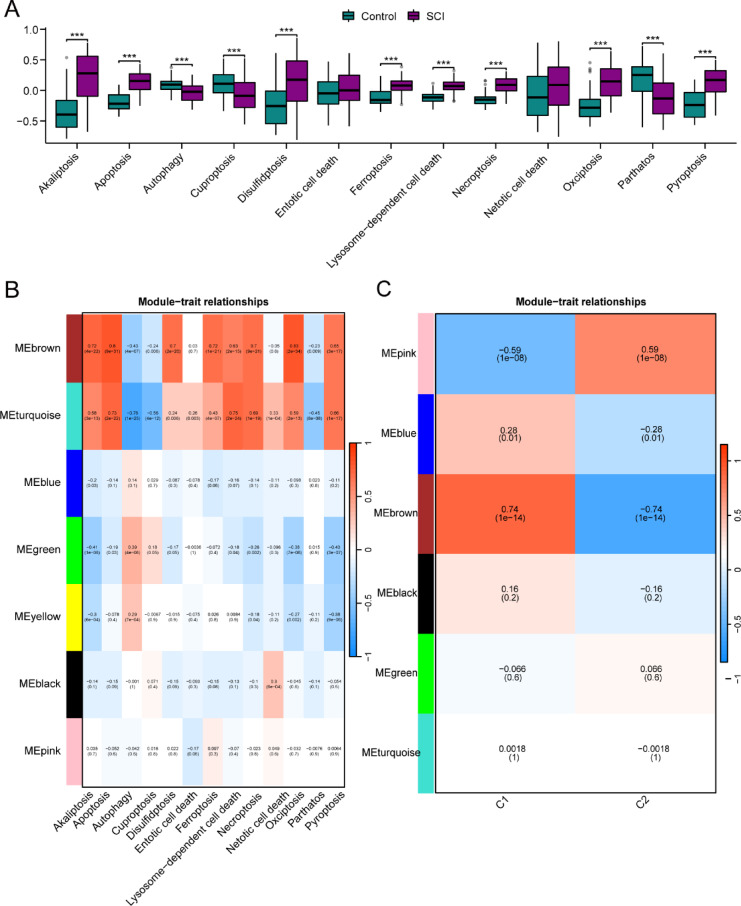
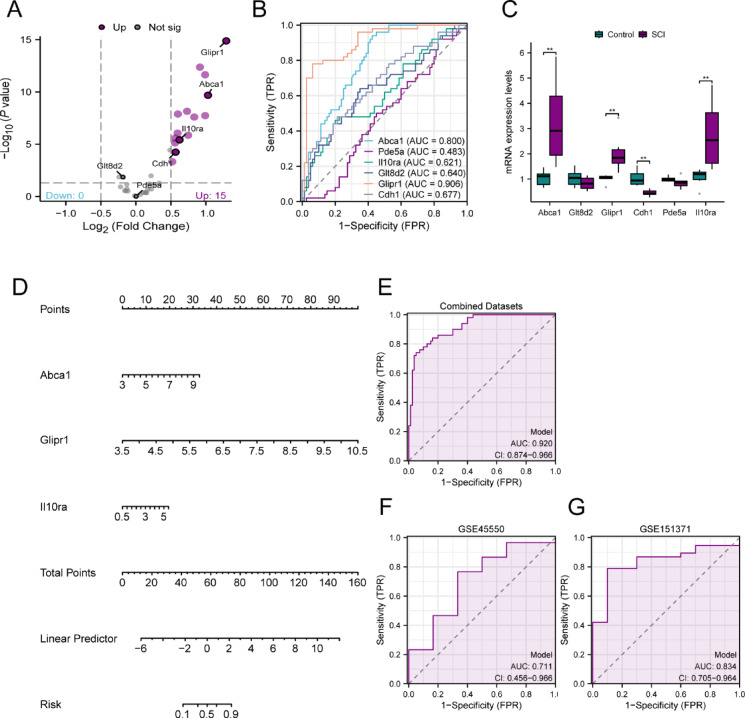
Spinal cord injury (SCI) is a severe neurological disorder, with glucocorticoids like methylprednisolone commonly used for treatment. However, their efficacy and risks remain controversial. Programmed cell death (PCD) mechanisms have been increasingly implicated in SCI pathology. This study aimed to identify differentially expressed genes (DEGs) related to glucocorticoid receptors and PCD and to construct a diagnostic model to guide glucocorticoid use in SCI treatment. SCI datasets (GSE5296, GSE47681, GSE151371, and GSE45550) were analyzed using protein-protein interaction networks, consensus clustering, GSVA for PCD pathway enrichment, and WGCNA. A total of 113 diagnostic models were developed through 12 machine learning algorithms, with the optimal model, "Lasso + Stepglm[both]," featuring six genes: Abca1, Cdh1, Glipr1, Glt8d2, Il10ra, and Pde5a. Validation through qRT-PCR confirmed the differential expression of four genes (Abca1, Glipr1, Il10ra, and Cdh1), which demonstrated strong predictive performance. Pathway enrichment of GRRDEGs was analyzed using GO, KEGG, and Bayesian network methods, and immune cell infiltration was assessed via CIBERSORT. In this study, we identified GR- and PCD-related DEGs in SCI and constructed a diagnostic model that may improve understanding of SCI molecular mechanisms and inform future investigations of glucocorticoid use.
© 2025. The Author(s).
Conflict of interest statement
Declarations. Competing interests: The authors declare no competing interests. Ethical approval: All procedures were conducted in accordance with the guidelines of the International Association for the Study of Pain (IASP) and were approved by the Ethics Committee of Gannan Medical University (2024-228). We confirm that this study is reported in accordance with the ARRIVE guidelines and adheres to the relevant ethical standards.
Figures
Similar articles
-
Identification and experimental validation of BMX as a crucial PANoptosis‑related gene for immune response in Spinal Cord Injury.PLoS One. 2025 Jul 15;20(7):e0328002. doi: 10.1371/journal.pone.0328002. eCollection 2025. PLoS One. 2025. PMID: 40663577 Free PMC article.
-
Metabolic Reprogramming in Spinal Cord Injury and Analysis of Potential Therapeutic Targets.J Mol Neurosci. 2025 Apr 16;75(2):50. doi: 10.1007/s12031-025-02343-6. J Mol Neurosci. 2025. PMID: 40237957
-
Identification and verification of immune and oxidative stress-related diagnostic indicators for malignant lung nodules through WGCNA and machine learning.Sci Rep. 2025 Jul 1;15(1):22449. doi: 10.1038/s41598-025-04639-4. Sci Rep. 2025. PMID: 40594252 Free PMC article.
-
Cost-effectiveness of using prognostic information to select women with breast cancer for adjuvant systemic therapy.Health Technol Assess. 2006 Sep;10(34):iii-iv, ix-xi, 1-204. doi: 10.3310/hta10340. Health Technol Assess. 2006. PMID: 16959170
-
Unique features of pediatric spinal cord injury.Spine (Phila Pa 1976). 2010 Oct 1;35(21 Suppl):S202-8. doi: 10.1097/BRS.0b013e3181f35acb. Spine (Phila Pa 1976). 2010. PMID: 20881463
References
-
- Karsy, M. & Hawryluk, G. Modern medical management of spinal cord injury. Curr. Neurol. Neurosci. Rep.19(9), 65. 10.1007/s11910-019-0984-1 (2019). - PubMed
-
- Bracken, M. B. et al. Administration of methylprednisolone for 24 or 48 hours or Tirilazad mesylate for 48 hours in the treatment of acute spinal cord injury: results of the third National acute spinal cord injury randomized controlled trial. National acute spinal cord injury study. JAMA277(20), 1597–1604. 10.1001/jama.1997.03540440031028 (1997). - PubMed
-
- Zhu, B. et al. Schwann cell-derived exosomes and methylprednisolone composite patch for spinal cord injury repair. ACS Nano17(22), 22928–22943. 10.1021/acsnano.3c08046 (2023). - PubMed
-
- Rabinstein, A. A. Traumatic spinal cord injury. Continuum24(2, Spinal Cord Disorders), 551–566. 10.1212/CON.0000000000000581 (2018). - PubMed
MeSH terms
Substances
Grants and funding
LinkOut - more resources
Full Text Sources
Medical
Miscellaneous
