

Development of BaSrTiO3 nanomaterial based dispersive solid phase microextraction method for cadmium determination in thyme samples using flame atomic absorption spectrometry
- PMID: 40624162
- PMCID: PMC12234940
- DOI: 10.1038/s41598-025-08464-7
Development of BaSrTiO3 nanomaterial based dispersive solid phase microextraction method for cadmium determination in thyme samples using flame atomic absorption spectrometry
Abstract
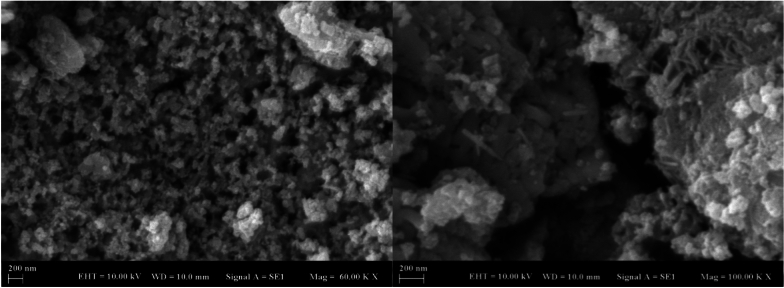
This study presents an efficient and straightforward approach for the easy synthesis and innovative analytical application of an industrial nanomaterial of BaSrTiO3 (BST). Characterization techniques including XRD (X-ray Diffraction), FTIR (Fourier transform infrared spectroscopy), and SEM (scanning electron microscopy) were utilized for characterizing the synthesized nanomaterial. Subsequently, the incorporation of BaSrTiO3 nanomaterial-based DSPME (dispersive solid phase microextraction) and FAAS (flame atomic absorption spectrophotometry) was implemented for the preconcentration of Cd with enhanced precision and accuracy. Each variable influencing the outcome of extraction efficiency has been defined in the optimization studies. The limit of quantification (LOQ) and limit of detection (LOD) values for the BaSrTiO3 (BST)-DSPME-FAAS system were determined to be 1.1 µg/L and 0.33 µg/L, respectively. Recovery examinations were conducted on two different thyme tea samples utilizing multiple calibration methodologies. The calculated percent recovery values from the spiked samples were in the range of 89.2-123%.
Keywords: Cadmium; Dispersive solid phase micro extraction; Flame atomic absorption spectrophotometry; Food analysis; Food composition; Thyme tea.
© 2025. The Author(s).
Conflict of interest statement
Declarations. Competing interest: The authors declare no competing interests. Ethical approval: This article does not contain any studies with human participants or animals performed by any of the authors.
Figures


Similar articles
-
Determination of Cd(II) and Zn(II) ions in honey samples by in-situ produced CO2-assisted dispersive micro solid phase based on covalent organic framework.Sci Rep. 2025 Sep 1;15(1):32235. doi: 10.1038/s41598-025-18045-3. Sci Rep. 2025. PMID: 40890435 Free PMC article.
-
Magnetic solid phase microextraction of cadmium in water and food samples on Escherichia coli immobilized to magnetic conductive carbon black (Vulcan XC-72) prior to its determination by flame atomic absorption spectrometry.Food Chem. 2025 Nov 15;492(Pt 1):145267. doi: 10.1016/j.foodchem.2025.145267. Epub 2025 Jun 27. Food Chem. 2025. PMID: 40617208
-
Dispersive micro solid phase extraction of cadmium on MIL-53(Al)@BaTiO3 nanocomposite from seafood samples.Turk J Chem. 2025 Apr 15;49(3):336-345. doi: 10.55730/1300-0527.3733. eCollection 2025. Turk J Chem. 2025. PMID: 40656883 Free PMC article.
-
Eliciting adverse effects data from participants in clinical trials.Cochrane Database Syst Rev. 2018 Jan 16;1(1):MR000039. doi: 10.1002/14651858.MR000039.pub2. Cochrane Database Syst Rev. 2018. PMID: 29372930 Free PMC article.
-
Health professionals' experience of teamwork education in acute hospital settings: a systematic review of qualitative literature.JBI Database System Rev Implement Rep. 2016 Apr;14(4):96-137. doi: 10.11124/JBISRIR-2016-1843. JBI Database System Rev Implement Rep. 2016. PMID: 27532314
References
-
- Zeb, M. et al. A review of heavy metals pollution in riverine sediment from various Asian and European countries: Distribution, sources, and environmental risk. Mar. Pollut. Bull.206, 116775. 10.1016/J.MARPOLBUL.2024.116775 (2024). - PubMed
-
- Khan, Z., Elahi, A., Bukhari, D. A. & Rehman, A. Cadmium sources, toxicity, resistance and removal by microorganisms-A potential strategy for cadmium eradication. J. Saudi Chem. Soc.26(6), 101569. 10.1016/J.JSCS.2022.101569 (2022).
LinkOut - more resources
Full Text Sources
