

Metabolomics combined with metagenomics analysis reveals the potential mechanism of Zhejiang psyllium polysaccharides against hyperuricemia in rats
- PMID: 40624236
- PMCID: PMC12234910
- DOI: 10.1038/s41598-025-09048-1
Metabolomics combined with metagenomics analysis reveals the potential mechanism of Zhejiang psyllium polysaccharides against hyperuricemia in rats
Abstract
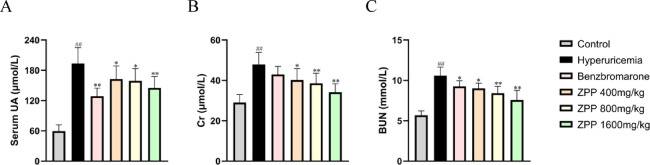
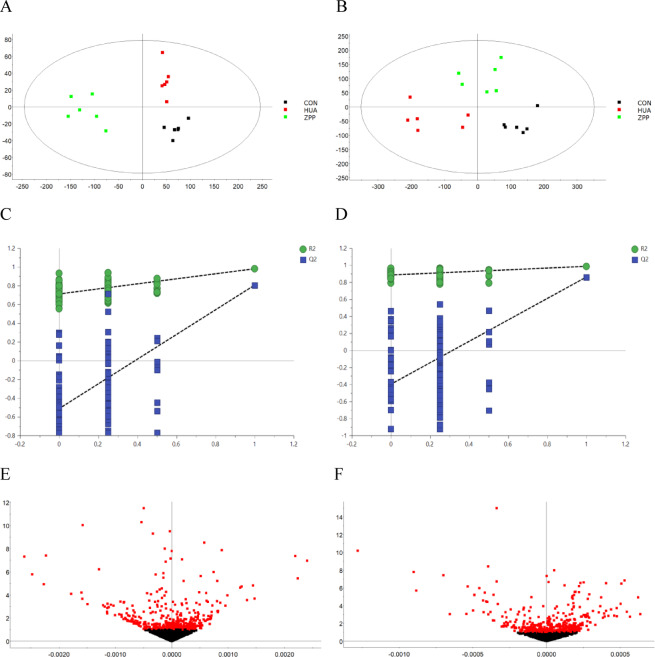
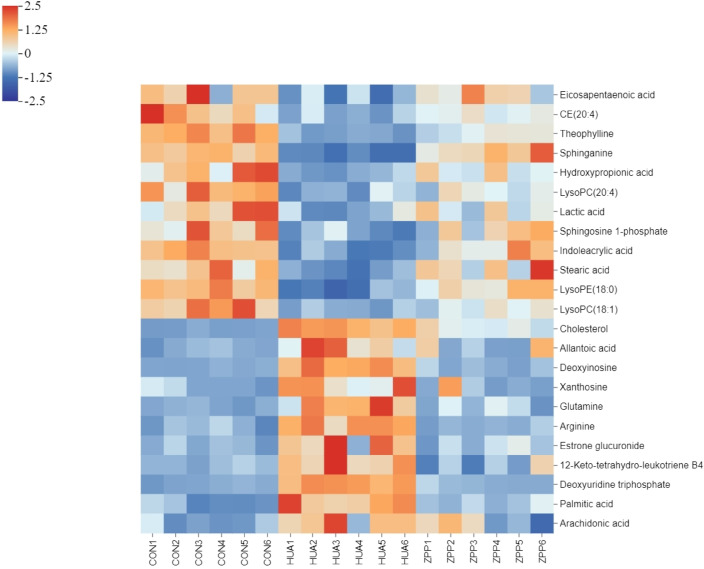
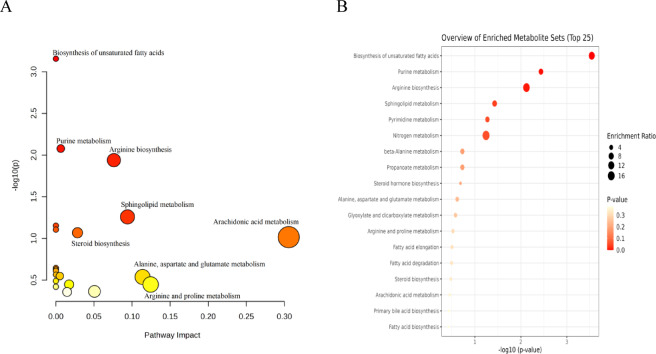
This study aimed to assess the anti-hyperuricemia efficacy of Zhejiang psyllium polysaccharides (ZPP) in rats and to explore its underlying mechanism. Hyperuricemia was induced by intragastric administration of potassium oxonate, hypoxanthine, and adenine. The serum levels of uric acid (UA), creatinine (Cr), and blood urea nitrogen (BUN) were measured, and kidney pathology was examined. Serum metabolomics was employed to monitor metabolic alterations following ZPP intervention. Metagenomic analysis was conducted to investigate the impact of ZPP on the intestinal flora of hyperuricemia rats. The results showed that ZPP could significantly reduce the serum UA level in hyperuricemia rats and exhibited a certain renal protective effect. The metabolomics results indicated that ZPP regulates uric acid levels in rats with hyperuricemia and ameliorates renal pathological changes by modulating biomarkers associated with purine metabolism, amino acid metabolism, and lipid metabolism. Metagenomic research also found that ZPP could increase the relative abundance of uric acid metabolism-related probiotics, such as Limosilactobacillus reuteri and Lactobacillus murinus, thereby improving intestinal flora imbalance in rats with hyperuricemia.
Keywords: Hyperuricemia; Metabolomics; Metagenomics; Polysaccharide; Zhejiang psyllium.
© 2025. The Author(s).
Conflict of interest statement
Declarations. Competing interest: The authors declare no competing interests. Ethical approval: The study was approved by the Experimental Animal Ethics Committee of the Academic Committee of Tianjin University of Chinese Medicine (project identification code: TCM-LAEC2022260n1453). All methods were carried out in accordance with relevant guidelines and regulations, and all animal studies complied with relevant ethical regulations on animal testing and research and followed by the ARRIVE guidelines ( https://arriveguidelines.org ).
Figures


Similar articles
-
Effect and Mechanism of Rhein-praseodymium Complex on Intestinal Uric Acid Excretion in Rats with Renal Injury and Hyperuricemia.Curr Med Chem. 2025;32(14):2838-2853. doi: 10.2174/0109298673268642231214061615. Curr Med Chem. 2025. PMID: 38243978
-
Rosmarinic acid attenuates hyperuricemia via restoring hyperuricemia-induced renal and intestinal dysfunctions.Phytomedicine. 2025 Sep;145:157084. doi: 10.1016/j.phymed.2025.157084. Epub 2025 Jul 16. Phytomedicine. 2025. PMID: 40684489
-
Secoisolariciresinol diglucoside (SDG) from flaxseed meal alleviates hyperuricemia in mice by regulating uric acid metabolism and intestinal homeostasis.Food Res Int. 2025 Oct;217:116770. doi: 10.1016/j.foodres.2025.116770. Epub 2025 Jun 9. Food Res Int. 2025. PMID: 40597493
-
To Treat or Not to Treat? Effect of Urate-Lowering Therapy on Renal Function, Blood Pressure and Safety in Patients with Asymptomatic Hyperuricemia: A Systematic Review and Network Meta-Analysis.J Am Board Fam Med. 2022 Jan-Feb;35(1):140-151. doi: 10.3122/jabfm.2022.01.210273. J Am Board Fam Med. 2022. PMID: 35039419
-
Effects of uric acid-lowering therapy on the progression of chronic kidney disease: a systematic review and meta-analysis.Ren Fail. 2018 Nov;40(1):289-297. doi: 10.1080/0886022X.2018.1456463. Ren Fail. 2018. PMID: 29619870 Free PMC article.
References
MeSH terms
Substances
LinkOut - more resources
Full Text Sources
