. 2025 Aug;44(16):4525-4551.
doi: 10.1038/s44318-025-00502-4. Epub 2025 Jul 7.

TERRA R-loops trigger a switch in telomere maintenance towards break-induced replication and PRIMPOL-dependent repair

Affiliations

TERRA R-loops trigger a switch in telomere maintenance towards break-induced replication and PRIMPOL-dependent repair

Suna In et al. EMBO J. 2025 Aug.

Abstract

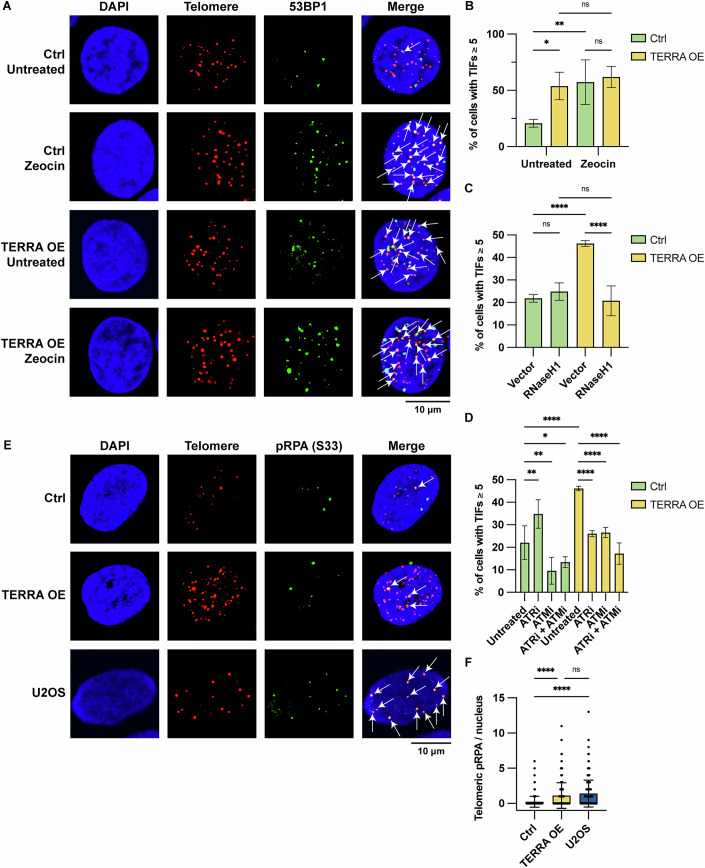
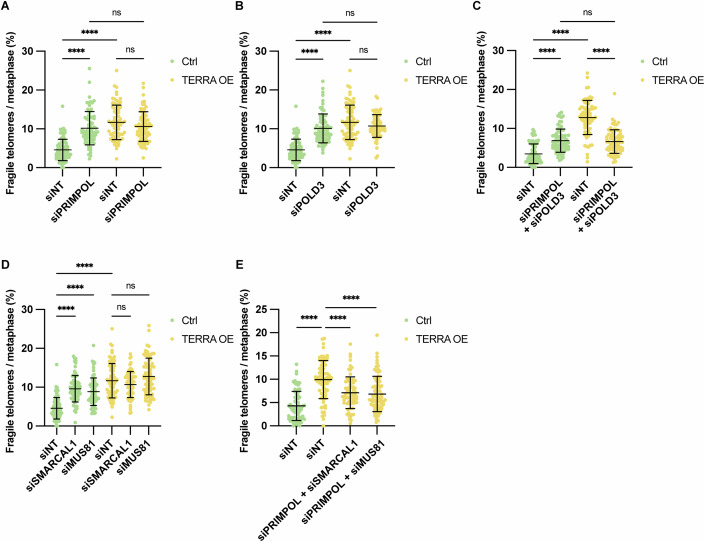
TERRA long noncoding RNAs associate with telomeres post transcription through base-pairing with telomeric DNA forming R-loop structures. TERRA regulates telomere maintenance but its exact modes of action remain unknown. Here, we induce TERRA transcription and R-loop formation in telomerase-expressing cells and determine that TERRA R-loop formation requires non-redundant functions of the RAD51 DNA recombinase and its enhancer RAD51AP1. TERRA R-loops interfere with semiconservative DNA replication, promoting telomere maintenance by a homology-directed repair (HDR) mechanism known as break-induced replication (BIR), which ensures telomere maintenance in ALT cancer cells. In addition, TERRA induces PRIMPOL-dependent repair, which can initiate DNA synthesis de novo downstream of replication obstacles. PRIMPOL acts in parallel to BIR for telomere maintenance of TERRA-overexpressing cells, promoting their survival. Similarly, we find that PRIMPOL depletion is synthetic-lethal with BIR deficiency in U2OS ALT cancer cells. Therefore, TERRA R-loops by themselves are sufficient to induce ALT-typical telomere repair mechanisms, in the absence of other ALT-typical telomeric chromatin changes.

Keywords: Break-induced Replication; PRIMPOL; R-loops; TERRA; Telomeres.


Conflict of interest statement

Disclosure and competing interests statement. The authors declare no competing interests.

Figures

Figure 1
Figure 1. TERRA overexpression leads to an increase in telomeric R-loops.
(A) Schematic representation of dCas9-VP64-induced expression of endogenous TERRA (top) and number of potential guide RNA binding sites near TERRA promoters (bottom). (B) RNA dot blot analysis (upper panel) of control and TERRA-overexpressing HeLa cells (containing average telomere length 10 kb) and various ALT cell lines (U2OS, VA13, GM847, and SAOS-2). Quantification of signal intensity (lower) is presented as fold change relative to control cells and normalized to 18S rRNA levels. Data represent the mean ± s.d. from three independent biological replicates. One-way analysis of variance (ANOVA) with Dunnett’s multiple comparisons test was applied. P values from left to right: ***P = 0.0004, ****P < 0.0001, **P = 0.0093, **P = 0.0047, ***P = 0.0003. (C) Quantification of TERRA levels by RT-qPCR analyzed using indicated subtelomeric primers, plotted as fold change over Ctrl and normalized to GAPDH RNA levels. Data represent mean ± s.d. from three independent biological replicates. Multiple unpaired t test was applied. P values from left to right: *P = 0.009, *P = 0.003, ns P = 0.153, ***P < 0.001, *P = 0.003, ns P = 0.067. (D, E) DRIP assay using S9.6 antibody. DRIP samples and inputs were treated with RNase (DNase-free) and analyzed by DNA dot blot with a 32P-radiolabeled telomeric probe (D) or by qPCR with indicated subtelomeric primers (E). As a negative control, samples treated in vitro with RNaseH1 prior to immunoprecipitation were analyzed in parallel. (D) Data represent mean ± s.d. from three independent biological replicates. Unpaired t test was applied. *P = 0.0321 (E) Data represent mean ± s.d. from three independent biological replicates. Multiple unpaired t test was applied. P values from left to right: **P = 0.0005, **P = 0.0028, **P = 0.0008, ***P < 0.0001, *P = 0.0112, *P = 0.0265. Source data are available online for this figure.
Figure 2
Figure 2. RAD51 and RAD51AP1 are required for TERRA R-loop formation.
(A) Western blot analysis upon depletion of RAD51 (left) or RAD51AP1 (right) in control and TERRA-overexpressing HeLa cells. (B) DRIP assay using S9.6 antibody. DRIP samples and inputs were treated with RNase (DNase-free) and analyzed by DNA dot blot with a 32P-radiolabeled telomeric probe. As a negative control, samples treated in vitro with RNaseH1 prior to immunoprecipitation were analyzed in parallel. Data represent mean ± s.d. from five independent biological replicates. Two-way analysis of variance (ANOVA) with Tukey’s multiple comparisons test was applied. P values from upper to lower: ****P < 0.0001, ****P < 0.0001, ****P < 0.0001. Source data are available online for this figure.
Figure 3
Figure 3. TERRA induces telomere dysfunction-induced foci (TIFs).
(A) Representative images for detection of 53BP1 at telomeres in control and TERRA-overexpressing HeLa cells. Immunofluorescence (IF) for 53BP1 (green) was combined with telomeric (CCCTAA)3-FISH (red) and DAPI staining (blue). White arrows indicate 53BP1 foci colocalizing with telomeres. (B) Quantification of the number of cells with ≥5 telomeres colocalizing with 53BP1. Data represent mean ± s.d. from three independent biological replicates. Two-way analysis of variance (ANOVA) with uncorrected Fisher’s least significant difference (LSD) test was applied. P values from left to right: *P = 0.0126, **P = 0.0077, ns P = 0.6679, ns P = 0.4572. (C) Quantification of the number of cells with ≥5 telomeres colocalizing with 53BP1 upon RNaseH1 overexpression. Data represent mean ± s.d. from three independent biological replicates. Two-way analysis of variance (ANOVA) with uncorrected Fisher’s least significant difference (LSD) test was applied. P values from left to right: ns P = 0.3822, ****P < 0.0001, ns P = 0.2428, ****P < 0.0001. (D) Quantification of the number of cells with ≥5 telomeres colocalizing with 53BP1 in the absence and presence of ATM and ATR inhibitors (KU-55933 and VE-821, respectively; 10 µM, 24-h treatment). Data represent mean ± s.d. from three independent biological replicates. Two-way analysis of variance (ANOVA) with uncorrected Fisher’s least significant difference (LSD) test was applied. P values from left to right: **P = 0.0041, **P = 0.0036, *P = 0.0329, ****P < 0.0001, ****P < 0.0001, ****P < 0.0001, ****P < 0.0001. (E) Representative images for detection of phosphorylated RPA32 (Ser33) at telomeres in control and TERRA-overexpressing HeLa cells. Immunofluorescence (IF) for pRPA (green) was combined with telomeric (CCCTAA)3-FISH (red) and DAPI staining (blue). White arrows indicate pRPA (S33) foci colocalizing with telomeres. (F) Quantifications of the number of pRPA foci colocalizing with telomeres per nucleus. Data are presented as a scatter plot with bars indicating the mean ± s.d. from three independent biological replicates. One-way analysis of variance (ANOVA) with Tukey’s multiple comparisons test was applied. P values from left to right: ****P < 0.0001, ****P < 0.0001, ns P = 0.0578. Source data are available online for this figure.
Figure 4
Figure 4. TERRA R-loops directly induce telomere fragility at both lagging and leading strands.
(A) Representative images of metaphase spreads stained with telomeric (CCCTAA)3-FISH probe (red) and DAPI (blue). While normal telomeres show a single round signal at the end of each chromosome arm (left), fragile telomeres have smeary (middle) or multiple telomeric signals (right). White arrowheads indicate fragile telomeres. (B) Quantification of telomere fragility upon depletion of TRF1 in control and TERRA-overexpressing HeLa cells. At least 25 metaphases were analyzed per condition per replicate, and three independent biological replicates were performed. Horizontal lines and error bars represent mean ± s.d. Two-way analysis of variance (ANOVA) with Tukey’s multiple comparisons test was applied. P values from left to right: ****P < 0.0001, ****P < 0.0001, ***P = 0.0005, *P = 0.0359. (C) DRIP (DNA:RNA hybrid immunoprecipitation) assay using S9.6 antibody. DRIP samples and inputs were treated with RNase (DNase-free) and analyzed by DNA dot blot with a 32P-radiolabeled telomeric probe. As a negative control, samples treated in vitro with RNaseH1 prior to immunoprecipitation were analyzed in parallel. Data represent mean ± s.d. from four independent biological replicates. Two-way analysis of variance (ANOVA) with Tukey’s multiple comparisons test was applied: P values from upper to lower: ****P < 0.0001, ****P < 0.0001. (D) Quantification of telomere fragility upon overexpression of RNaseH1 in control and TERRA-overexpressing HeLa cells. At least 25 metaphases were analyzed per condition per replicate, and three independent biological replicates were performed. Horizontal lines and error bars represent mean ± s.d. Two-way analysis of variance (ANOVA) with Tukey’s multiple comparisons test was applied. P values from left to right: ns P = 0.4679, ****P < 0.0001, ****P < 0.0001. (E) Quantification of telomere fragility upon depletion of RAD51 or RAD51AP1 in control and TERRA-overexpressing HeLa cells. At least 25 metaphases were analyzed per condition per replicate, and three independent biological replicates were performed. Horizontal lines and error bars represent mean ± s.d. Two-way analysis of variance (ANOVA) with Tukey’s multiple comparisons test was applied. P values from left to right: ****P < 0.0001, *P = 0.0155, ****P < 0.0001, **P = 0.0067, ns P = 0.2408, ****P < 0.0001, ****P < 0.0001. (F) (Top) Schematic of the CO-FISH experiment. HeLa cells were incubated with BrdU and BrdC for 15 h to ensure incorporation during a single round of replication. After metaphase enrichment via demecolcine treatment, cells were harvested, and metaphases were spread onto microscopic slides. Following RNaseA treatment and Hoechst staining, the newly synthesized DNA strands that incorporated BrdU and BrdC were degraded upon UV irradiation followed by Exonuclease III digestion. The remaining parental DNA strands were then hybridized with strand-specific probes. The blue lines indicate parental strands, the dashed gray lines indicate BrdU/BrdC incorporated newly synthesized DNA strands, the red line indicates lagging strand-specific probes, and the green line indicates leading strand-specific probes. (Bottom) Representative images of metaphase spreads stained with TYE563-TeloC LNA probe (red), FAM-TeloG LNA probe (yellow), and DAPI (blue). White arrowheads indicate fragile telomeres. (G) Quantification of telomere fragility at lagging strand upon depletion of TRF1 in control and TERRA-overexpressing HeLa cells with 30 kb telomeres. At least 25 metaphases were analyzed per condition per replicate, and three independent biological replicates were performed. Horizontal lines and error bars represent mean ± s.d. Two-way analysis of variance (ANOVA) with Tukey’s multiple comparisons test was applied. P values from left to right: ****P < 0.0001, ****P < 0.0001, ****P < 0.0001. (H) Quantification of telomere fragility at the leading strand upon depletion of TRF1 in control and TERRA-overexpressing HeLa cells with 30 kb telomeres. At least 25 metaphases were analyzed per condition per replicate, and three independent biological replicates were performed. Horizontal lines and error bars represent mean ± s.d. Two-way analysis of variance (ANOVA) with Tukey’s multiple comparisons test was applied. P values from left to right: ****P < 0.0001, ****P < 0.0001, ****P < 0.0001. Data from Figs. 4B,E and 5A,B,D stem from common experiments explaining the identity of the siNT control in these panels. Source data are available online for this figure.
Figure 5
Figure 5. Repriming and BIR pathways act in parallel to repair TERRA R-loop-mediated telomere damage.
(A) Quantification of telomere fragility upon depletion of PRIMPOL in control and TERRA-overexpressing HeLa cells. At least 25 metaphases were analyzed per condition per replicate, and three independent biological replicates were performed. Horizontal line and error bars represent mean ± s.d. Two-way analysis of variance (ANOVA) with Tukey’s multiple comparisons test was applied. P values from left to right: ****P < 0.0001, ****P < 0.0001, ns P = 0.9085, ns P = 0.3182. (B) Quantification of telomere fragility upon depletion of POLD3 in control and TERRA-overexpressing HeLa cells. At least 25 metaphases were analyzed per condition per replicate, and three independent biological replicates were performed. Horizontal lines and error bars represent mean ± s.d. Two-way analysis of variance (ANOVA) with Tukey’s multiple comparisons test was applied. P values from left to right: ****P < 0.0001, ****P < 0.0001, ns P = 0.7053, ns P = 0.3600. (C) Quantification of telomere fragility upon co-depletion of PRIMPOL and POLD3 in control and TERRA-overexpressing HeLa cells. At least 25 metaphases were analyzed per condition per replicate, and three independent biological replicates were performed. Horizontal lines and error bars represent mean ± s.d. Two-way analysis of variance (ANOVA) with Tukey’s multiple comparisons test was applied. P values from left to right: ****P < 0.0001, ****P < 0.0001, ns P = 0.9778, ****P < 0.0001. (D) Quantification of telomere fragility upon depletion of PRIMPOL, SMARCAL1 or MUS81 in control and TERRA-overexpressing HeLa cells. At least 25 metaphases were analyzed per condition per replicate, and three independent biological replicates were performed. Horizontal lines and error bars represent mean ± s.d. Two-way analysis of variance (ANOVA) with Tukey’s multiple comparisons test was applied. P values from left to right: ****P < 0.0001, ****P < 0.0001, ****P < 0.0001, ns P = 0.5932, ns P = 0.4629. (E) Quantification of telomere fragility upon co-depletion of PRIMPOL and SMARCAL1 or MUS81 in control and TERRA-overexpressing HeLa cells. At least 25 metaphases were analyzed per condition per replicate, and three independent biological replicates were performed. Horizontal lines and error bars represent mean ± s.d. One-way analysis of variance (ANOVA) with Dunnett’s multiple comparisons test was applied. P values from left to right: ****P < 0.0001, ****P < 0.0001, ****P < 0.0001. Data from Figs. 4B,E and 5A,B,D stem from common experiments explaining the identity of the siNT control in these panels. Source data are available online for this figure.
Figure 6
Figure 6. TERRA-induced DNA damage requires a conservative repair pathway.
(A) Schematic representation of two possible scenarios that occur during DNA repair caused by TERRA R-loops. The red line represents the parental strand for lagging strand synthesis, while the green line represents the parental strand for leading strand synthesis. Solid gray lines indicate newly synthesized DNA during replication, and dashed gray lines represent newly synthesized DNA during repair. Both the solid and dashed gray lines are degraded and therefore not detected in CO-FISH experiments. (B) Representative images of telomeric loss by FISH (left) or CO-FISH (middle and right). Metaphase spreads were stained with telomeric (CCCTAA)3-FISH probe (red) and DAPI (blue) (left), with TYE563-TeloC LNA probe (red), FAM-TeloG LNA probe (yellow), and DAPI (blue) (middle and right). (C) Quantification of telomeric loss upon depletion of PRIMPOL or POLD3 in control and TERRA-overexpressing HeLa cells with 30 kb telomeres. Metaphases from the same samples were analyzed by FISH (left) and CO-FISH (middle and right). At least 25 metaphases were analyzed per condition per replicate, and three independent biological replicates were performed. Horizontal lines and error bars represent mean ± s.d. Two-way analysis of variance (ANOVA) with Tukey’s multiple comparisons test was applied. P values from left to right: ns P = 0.9488, ns P = 0.7600, ns P = 0.3306, ns P > 0.9999, ns P = 0.9956 (left). ns P = 0.2245, ns P = 0.6074, *P = 0.0296, ns P = 0.8659, ns P = 0.9807 (middle). ns P = 0.9811, ns P = 0.8554, ****P < 0.0001, **P = 0.0037, ns P = 0.1507 (right). (D) Representative images showing EdU incorporation (yellow) at telomeres in control and TERRA-overexpressing HeLa cells. Click-iT detection was combined with telomeric (CCCTAA)3-FISH (red) and DAPI staining (blue). White arrowheads EdU foci colocalizing with telomeres. (E) Quantification of cells exhibiting EdU-positive telomeres. Data represent mean ± s.d. from three independent biological replicates. One-way analysis of variance (ANOVA) with Tukey’s multiple comparisons test was applied. P values from left to right: **P = 0.0012, ****P < 0.0001, **P = 0.0062. (F) HeLa control, TERRA overexpression, and U2OS cells were categorized into five groups (0, 1–2, 3–4, 5–6, and ≥7) based on the number of EdU-positive telomeres per cell. Data represent mean ± s.d. from three independent biological replicates. (G) Statistical analysis of EdU-positive telomeres across control HeLa, TERRA-overexpressing HeLa, and U2OS cells. Data were analyzed using one-way analysis of variance (ANOVA) with Tukey’s multiple comparisons test. P values from left to right: **P = 0.0012, ***P = 0.0010, ns P = 0.0658, ns P = 0.5794, ns P = 0.9257 (Ctrl vs TERRA OE). ****P < 0.0001, ***P = 0.0001, **P = 0.0066, ns P = 0.1116, * P = 0.0388 (Ctrl vs U2OS). **P = 0.0062, *P = 0.0273, ns P = 0.1849, ns P = 0.4046, ns P = 0.0616 (TERRA OE vs U2OS). Source data are available online for this figure.
Figure 7
Figure 7. Model for TERRA R-loop formation, replication interference and repair.
(A) WST-8 cell proliferation assay upon co-depletion of PRIMPOL and POLD3 in control and TERRA-overexpressing HeLa cells. After seeding, cell viability was measured every 24 h. siRNA transfection was performed at 24 h. Data represent mean ± s.d. from three independent biological replicates. Two-way analysis of variance (ANOVA) with Tukey’s multiple comparisons test was applied. P values from upper to lower: ****P < 0.0001, ****P < 0.0001. (B) WST-8 cell proliferation assay upon single or co-depletion of PRIMPOL and/or POLD3 in U2OS cells. After seeding, cell viability was measured every 24 h. siRNA transfection was performed at 24 h. Data represent mean ± s.d. from three independent biological replicates. One-way analysis of variance (ANOVA) with Dunnett’s multiple comparisons test was applied: P values from upper to lower: ns P = 0.8849, ns P = 0.3712, ****P < 0.0001. (C) RAD51 and RAD51AP1 are both required for the formation of TERRA R-loops post transcription. TERRA R-loops can be destroyed by RNaseH1. In S phase, TERRA R-loops interfere with the DNA replication fork progression giving rise to telomere damage and repair. Two main pathways are involved in the repair of TERRA R-loop damaged DNA. Either PRIMPOL mediates fork restart downstream of TERRA R-loops or the truncated telomeric DNA is repaired by POLD3-dependent BIR. While the specific roles of SMARCAL1 and MUS81 in these processes have not been precisely defined, they function in parallel to PRIMPOL and may prepare the replication-impaired telomeric DNA for strand invasion and repair synthesis. Remaining gaps due to incomplete DNA repair synthesis may give rise to telomere fragility. Gray lines represent newly synthesized DNA by semiconservative DNA replication. Purple dashed lines denote gaps which may remain from TERRA R-loops. Light blue lines represent newly synthesized DNA via BIR, with gaps indicating regions of incomplete DNA synthesis. This model does only depict repair pathways at the leading strand telomeres. We speculate that elevated G-quadruplex formation at single-stranded G-rich strands, driven by TERRA R-loops may contribute to the enhanced fragility at the lagging strand. Source data are available online for this figure.
Figure EV1
Figure EV1. Induction of endogenous TERRA by modified CRISPR-Cas9 system, related to Fig. 1.
(A, B) ChIP assay using H4 acetylation antibody. ChIP samples and inputs were treated with RNase (DNase-free) and analyzed by qPCR with indicated subtelomeric primers (A) or by DNA dot blot with a 32P-radiolabeled telomeric probe (B). Multiple unpaired t test was applied. Data represent mean ± s.d. from three independent biological replicates. P values from left to right: *P = 0.0166, *P = 0.0269, ns P = 0.3148, *P = 0.0290, *P = 0.0163, *P = 0.0271. Source data are available online for this figure.
Figure EV2
Figure EV2. DNA damage upon TERRA overexpression and zeocin treatment, related to Fig. 3.
(A) Quantification of the number of cells with ≥5 53BP1 foci. Data represent mean ± s.d. from three independent biological replicates. Two-way analysis of variance (ANOVA) with uncorrected Fisher’s least significant difference (LSD) test was applied. P values from left to right: ****P < 0.0001, ****P < 0.0001, ***P = 0.0003, ns P = 0.5932. (B) Quantification of the number of cells with ≥5 53BP1 foci that are not colocalizing with telomeres. Data represent mean ± s.d. from three independent biological replicates. Two-way analysis of variance (ANOVA) with uncorrected Fisher’s least significant difference (LSD) test was applied. P values from left to right: ns P = 0.6179, ****P < 0.0001, ***P = 0.0002, ns P = 0.1704. (C) Western blot analysis upon ectopic expression of RNaseH1 in control and TERRA-overexpressing HeLa cells. Source data are available online for this figure.
Figure EV3
Figure EV3. Fragile and outsider telomeres, related to Fig. 4.
(A) Western blot analysis upon depletion of TRF1 in control and TERRA-overexpressing HeLa cells. (B) Western blot analysis upon ectopic expression of RNaseH1 WT or D145N mutant in control and TERRA overexpressing HeLa cells. (C) Western blot analysis upon depletion of RNaseH1 in control and TERRA-overexpressing HeLa cells. (D) Quantification of telomere fragility upon depletion of RNaseH1 in control and TERRA overexpressing HeLa cells. At least 25 metaphases were analyzed per condition per replicate, and three independent biological replicates were performed. Horizontal lines and error bars represent mean ± s.d. Two-way analysis of variance (ANOVA) with Tukey’s multiple comparisons test was applied. P values from left to right: ****P < 0.0001, ****P < 0.0001, ns P = 0.3221, ns P = 0.5391. (E) Quantification of telomere fragility upon depletion of TRF1 in control and TERRA-overexpressing HeLa cells with 30 kb telomeres. At least 25 metaphases were analyzed per condition per replicate, and three independent biological replicates were performed. Horizontal lines and error bars represent mean ± s.d. Two-way analysis of variance (ANOVA) with Tukey’s multiple comparisons test was applied. P values from left to right: ****P < 0.0001, ****P < 0.0001, ****P < 0.0001, **P = 0.0012. (F) Representative images of outsider telomeres by FISH (left) or CO-FISH (middle and right). Metaphase spreads were stained with telomeric (CCCTAA)3-FISH probe (red) and DAPI (blue) (left), with TYE563-TeloC LNA probe (red), FAM-TeloG LNA probe (yellow), and DAPI (blue) (middle and right). (G) Quantification of outsider telomeres upon depletion of TRF1 in control and TERRA-overexpressing HeLa cells with 30 kb telomeres. Metaphases from the same samples were analyzed by FISH (left) and CO-FISH (middle and right). At least 25 metaphases were analyzed per condition per replicate, and three independent biological replicates were performed. Horizontal lines and error bars represent mean  ± s.d. Two-way analysis of variance (ANOVA) with Tukey’s multiple comparisons test was applied. P values from left to right: ****P < 0.0001, ns P = 0.9852, ns P = 0.9997, ****P < 0.0001 (left). ****P < 0.0001, ns P = 0.9907, ns P = 0.7167, ****P < 0.0001 (middle). ****P < 0.0001, ns P = 0.9971, ns P = 0.9987, ****P < 0.0001 (right). Source data are available online for this figure.
Figure EV4
Figure EV4. Western blot analyses of depletion of proteins involved in telomere fragility, related to Fig. 5.
(A) Western blot analysis upon depletion of PRIMPOL in control and TERRA-overexpressing HeLa cells. (B) Western blot analysis upon depletion of POLD3 in control and TERRA-overexpressing HeLa cells. (C) Cell cycle profiles upon PRIMPOL and POLD3 depletion. DNA content was analyzed by flow cytometry analysis of fixed DAPI-stained cells at day 4 of the time course (last time point). Data represent mean ± s.d. from three independent biological replicates. (D) DRIP assay using S9.6 antibody. DRIP samples and inputs were treated with RNase (DNase-free) and analyzed by DNA dot blot with a 32P-radiolabeled telomeric probe. As a negative control, samples were treated in vitro with RNaseH1 prior to immunoprecipitation and analyzed in parallel. Data represent mean ± s.d. from three independent biological replicates. One-way analysis of variance (ANOVA) with Šídák’s multiple comparisons test was applied. P values from upper to lower: *P = 0.0389, ns P = 0.9668, ns P = 0.9965, ns P = 0.9899. (E) Western blot analysis upon depletion of SMARCAL1 in control and TERRA-overexpressing HeLa cells. (F) Western blot analysis upon depletion of MUS81 in control and TERRA-overexpressing HeLa cells. Source data are available online for this figure.
Figure EV5
Figure EV5. Impacts of depletion of PRIMPOL, POLD3, SMARCAL1, and MUS81, related to Fig. 6.
(A) Quantification of telomere fragility upon depletion of PRIMPOL or POLD3 in control and TERRA-overexpressing HeLa cells with 30 kb telomeres. Metaphases from the same samples were analyzed by FISH (left) and CO-FISH (middle and right). At least 25 metaphases were analyzed per condition per replicate, and three independent biological replicates were performed. Horizontal lines and error bars represent mean ± s.d. Two-way analysis of variance (ANOVA) with Tukey’s multiple comparisons test was applied. P values from left to right: ****P < 0.0001, ****P < 0.0001, ****P < 0.0001, ns P = 0.3957, ns P = 0.1627 (left). ****P < 0.0001, ****P < 0.0001, ****P < 0.0001, ns P = 0.9998, ns P = 0.7558 (middle). ****P < 0.0001, ****P < 0.0001, ****P < 0.0001, ns P = 0.5791, ns P = 0.9580 (right). (B) Quantification of cells exhibiting non-telomeric EdU foci. Data represent mean ± s.d. from three independent biological replicates. One-way analysis of variance (ANOVA) with Tukey’s multiple comparisons test was applied. p values from left to right: ns P = 0.7029, ns P = 0.7485, ns P = 0.9964. (C) Telomere restriction fragment (TRF) analysis of control and TERRA-overexpressing HeLa cells at baseline (“Week 0,” immediately before gRNA transduction) and after 5 weeks (“Week 5”). (D) Phi29 C-circle assay performed on 10 ng, 3 ng, and 1 ng of DNA from control and TERRA-overexpressing HeLa cells, as well as U2OS cells. Amplification products were analyzed by dot blot using a ³²P-labeled C-rich telomeric probe. (E) Quantification of PML bodies colocalizing with telomeres. Data represent one biological replicate. (F) Quantification of reciprocal telomeric sister chromatid exchange, as a percentage of events per metaphase spread. At least 25 metaphases were analyzed per condition per replicate, and three independent biological replicates were performed. Horizontal lines and error bars represent mean ± s.d. Two-way analysis of variance (ANOVA) with Tukey’s multiple comparisons test was applied: ns indicates non-significance (P > 0.05). P values from left to right: ns P = 0.9110, ns P = 0.4455, ns P = 0.9490, ns P = 0.5211. Source data are available online for this figure.

Similar articles

Cited by

References

    1. Aguilera A, Ruzov A (eds) (2022) R-Loops: methods and protocols. Springer US, New York, NY
    1. Arora R, Lee Y, Wischnewski H, Brun CM, Schwarz T, Azzalin CM (2014) RNaseH1 regulates TERRA-telomeric DNA hybrids and telomere maintenance in ALT tumour cells. Nat Commun 5:5220 - PMC - PubMed
    1. Azzalin CM, Reichenbach P, Khoriauli L, Giulotto E, Lingner J (2007) Telomeric repeat containing RNA and RNA surveillance factors at mammalian chromosome ends. Science 318:798–801 - PubMed
    1. Bailey SM, Goodwin EH, Meyne J, Cornforth MN (1996) CO-FISH reveals inversions associated with isochromosome formation. Mutagenesis 11:139–144 - PubMed
    1. Barde I, Salmon P, Trono D (2010) Production and titration of lentiviral vectors. Curr Protoc Neurosci 53:4.21.1–4.21.23 - PubMed

LinkOut - more resources