. 2025 Jul 7;16(1):1278.
doi: 10.1007/s12672-025-03118-6.

Multi-omics analysis of the effects of pla2g4a on the prognosis of various cancers and its experimental validation in breast cancer cell lines

Affiliations

Multi-omics analysis of the effects of pla2g4a on the prognosis of various cancers and its experimental validation in breast cancer cell lines

Yao Qian et al. Discov Oncol. .

Abstract

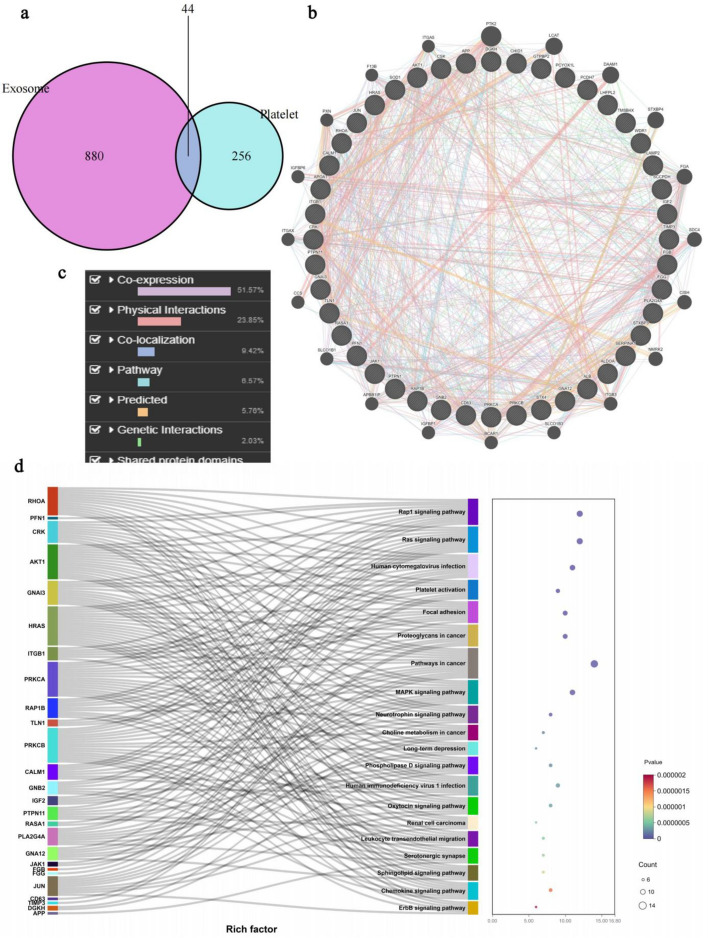
Background: Platelet-related exosomes (PREs) are microparticles secreted by platelets into the bloodstream and are implicated in various cancer processes. This study aims to identify critical genes involved in Breast Cancer (BC)-associated PREs and to evaluate their role in cancer prognosis. PLA2G4A was identified as a key gene through the use of machine learning techniques and various genomic analyses, providing a foundation for precision medicine in BC treatment.

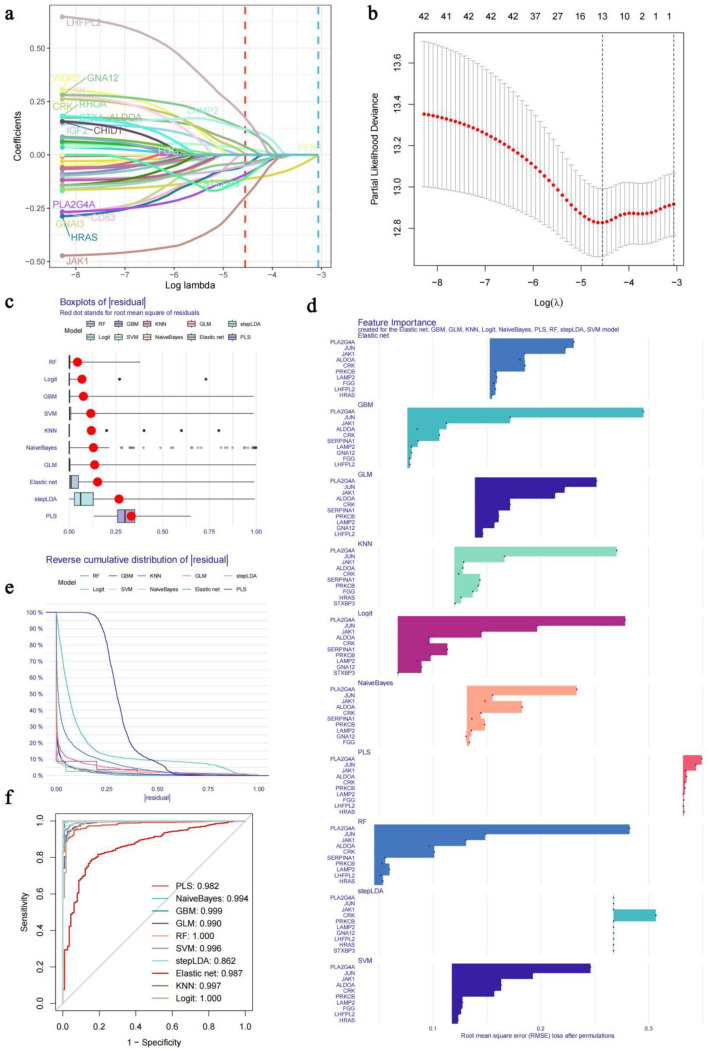
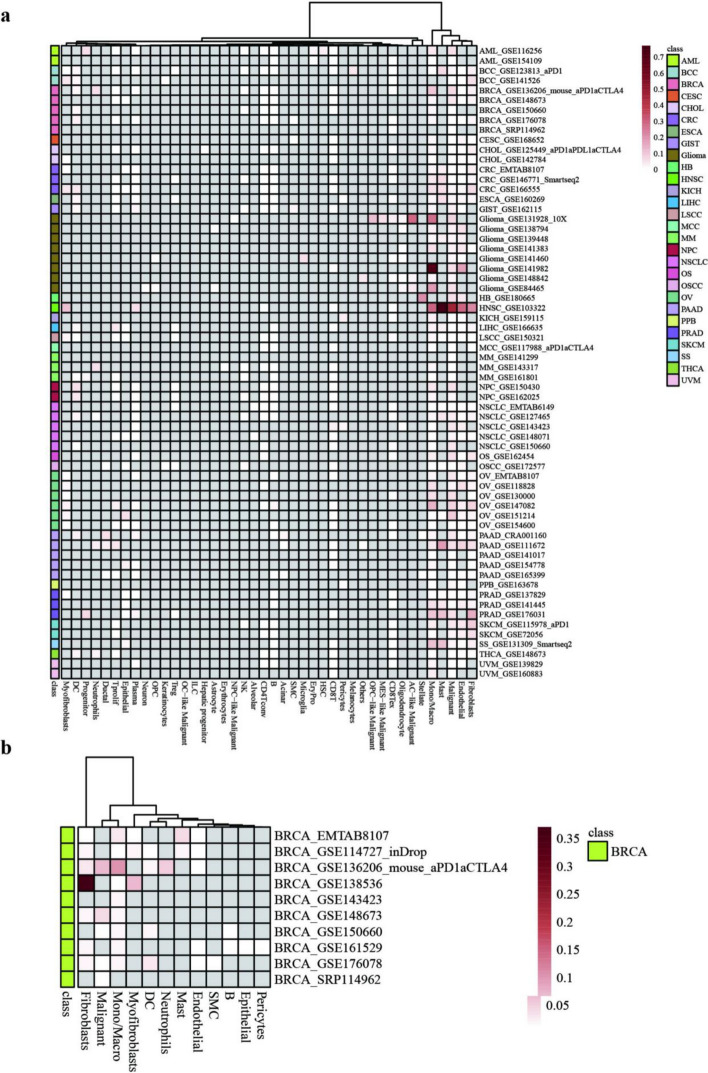
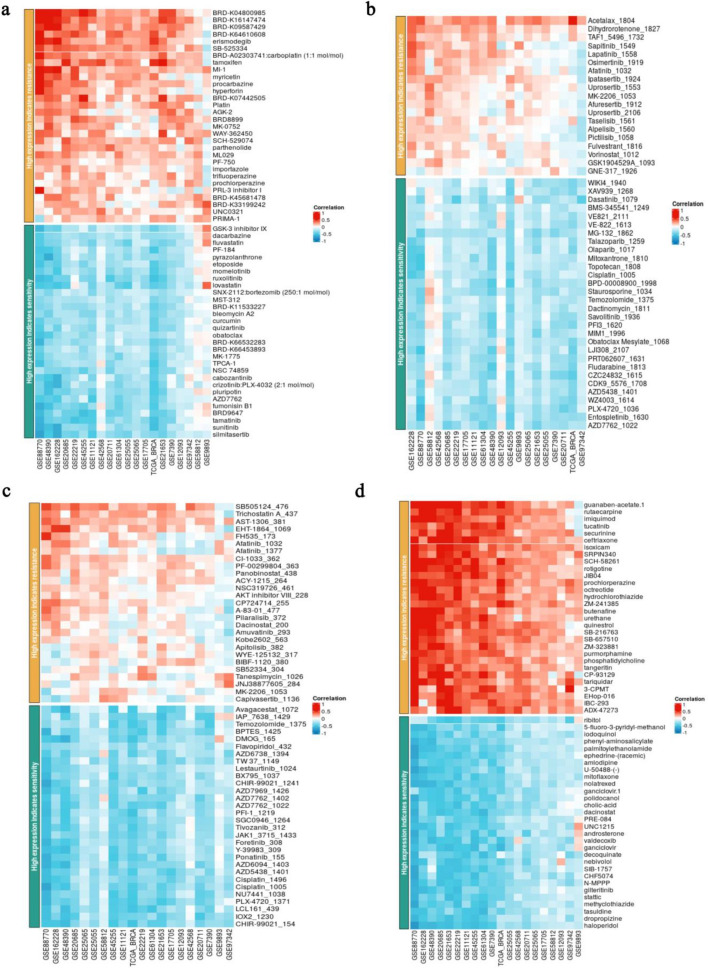
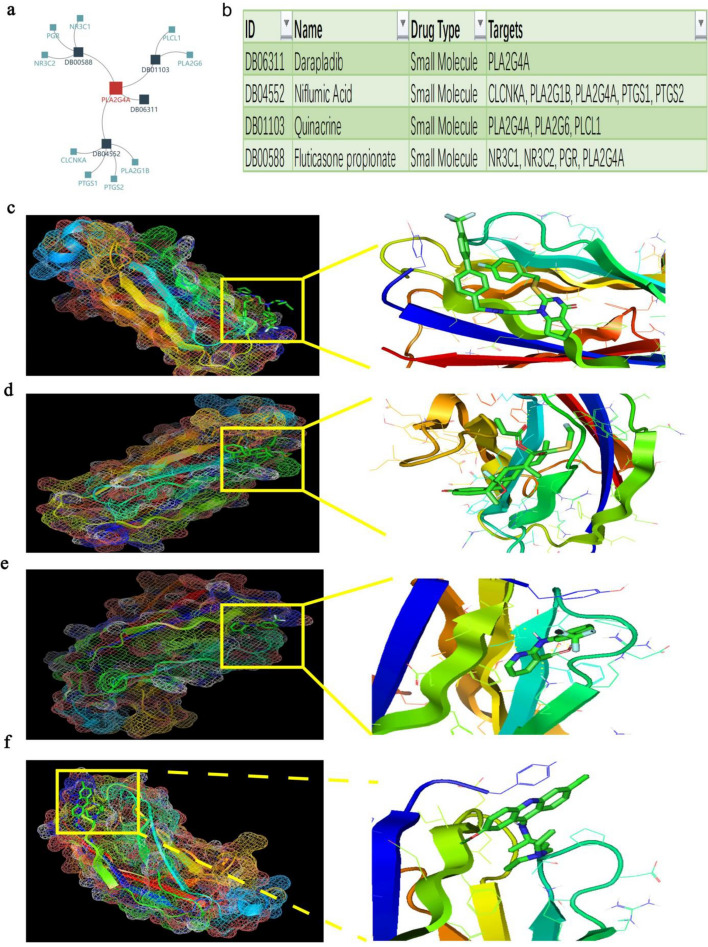
Methods: Download cancer-related data from databases such as UCSC Xena and ExMdb, use LASSO Cox regression and various machine learning algorithms to screen genes associated with BC survival, and perform functional and pathway enrichment analysis. The expression, immune relevance, diagnostic efficacy, and drug sensitivity of the PLA2G4A gene in pan-cancer and BC were specifically analyzed. The function of PLA2G4A in BC was validated through experiments, and its drug response and molecular docking were predicted using various databases and software tools.

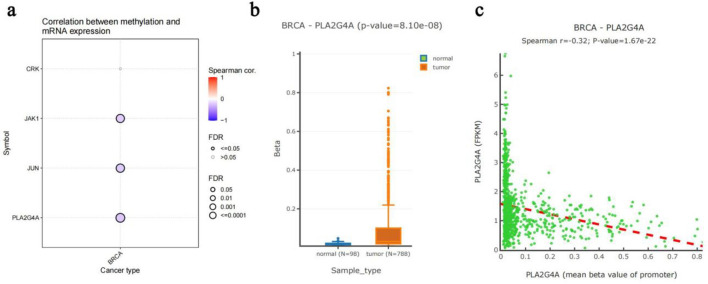
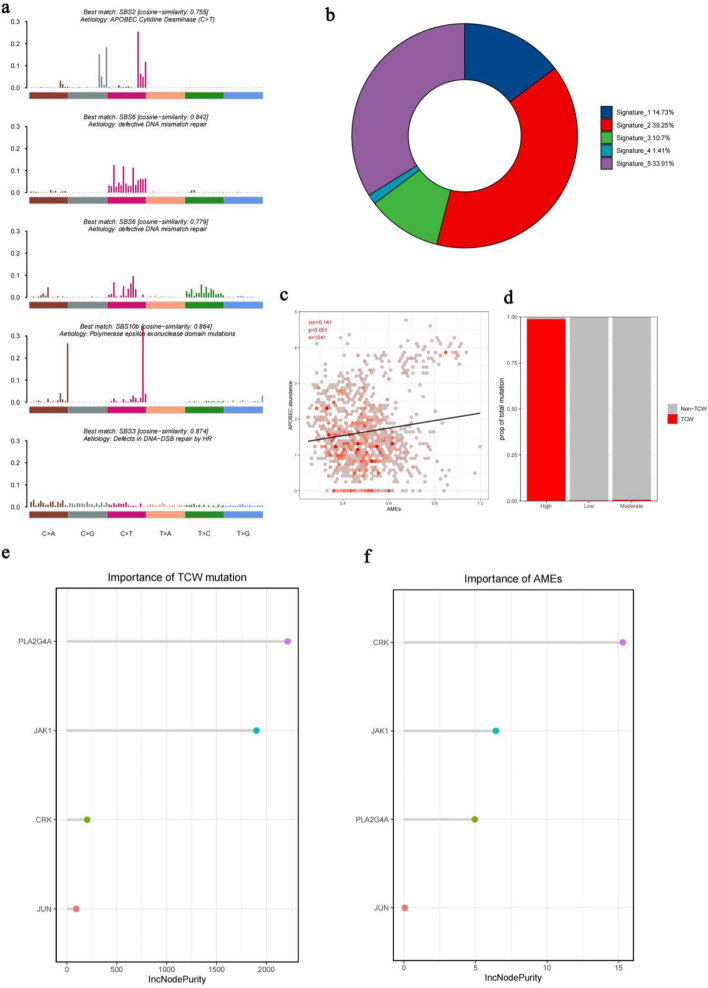
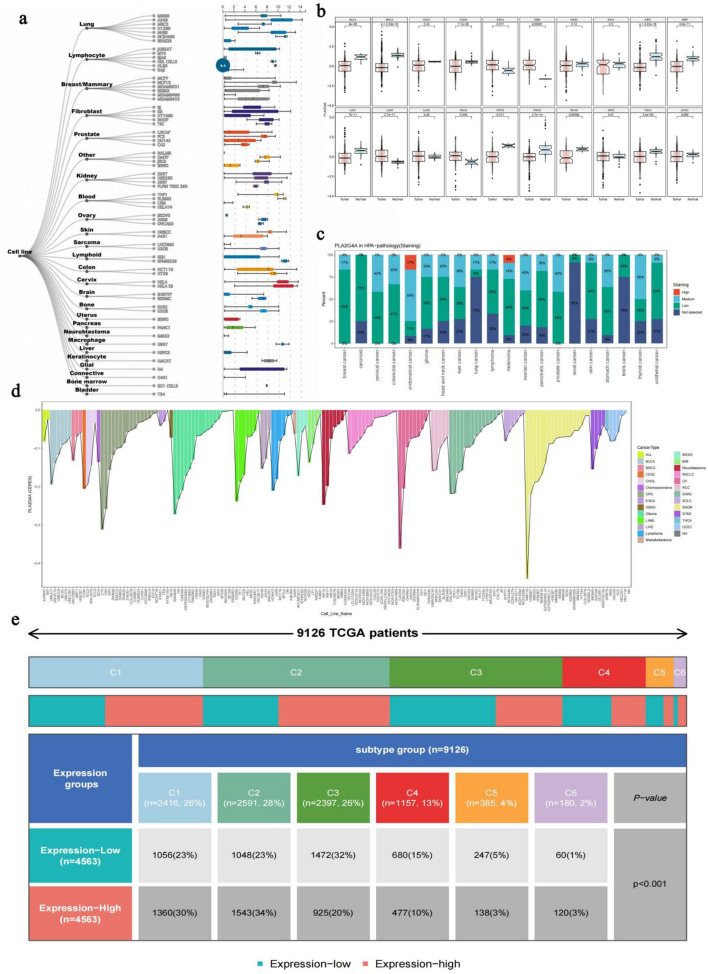
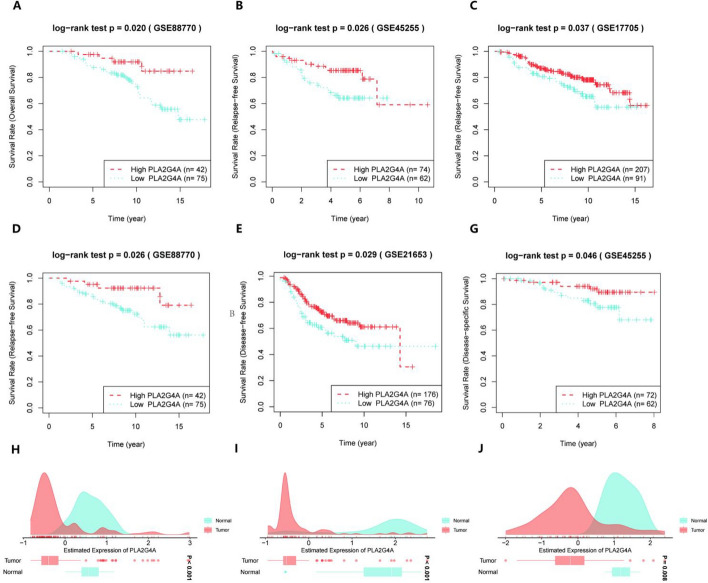
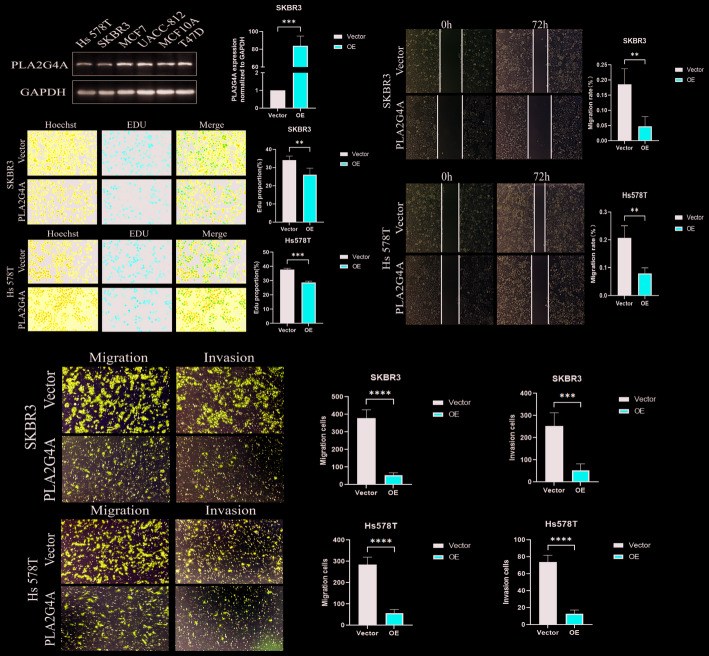
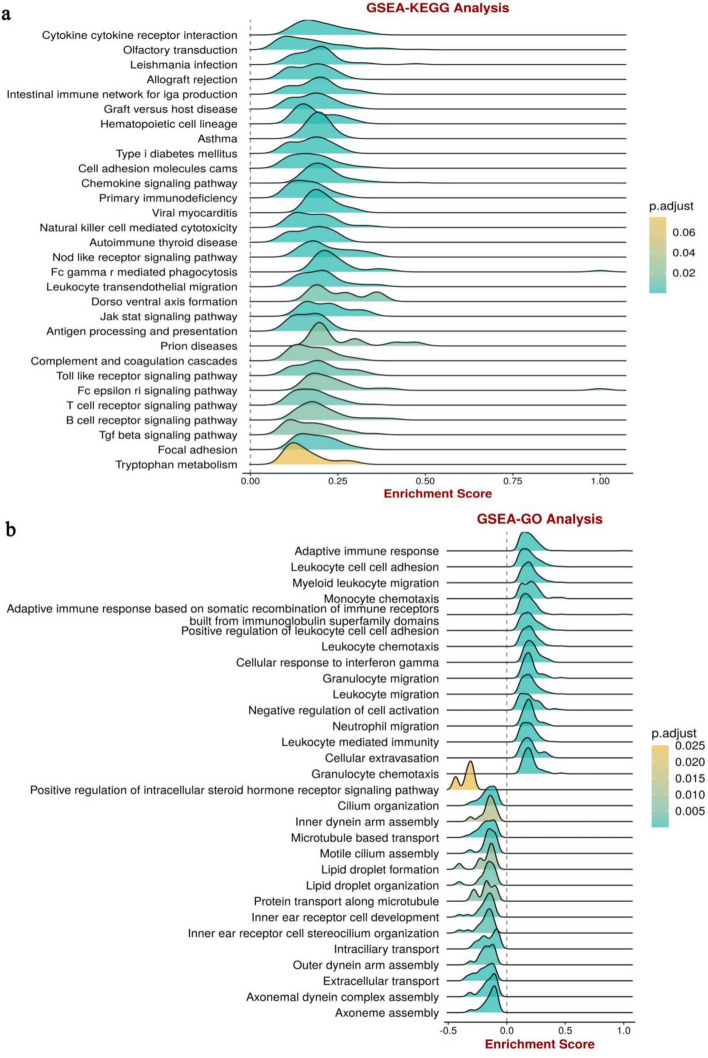
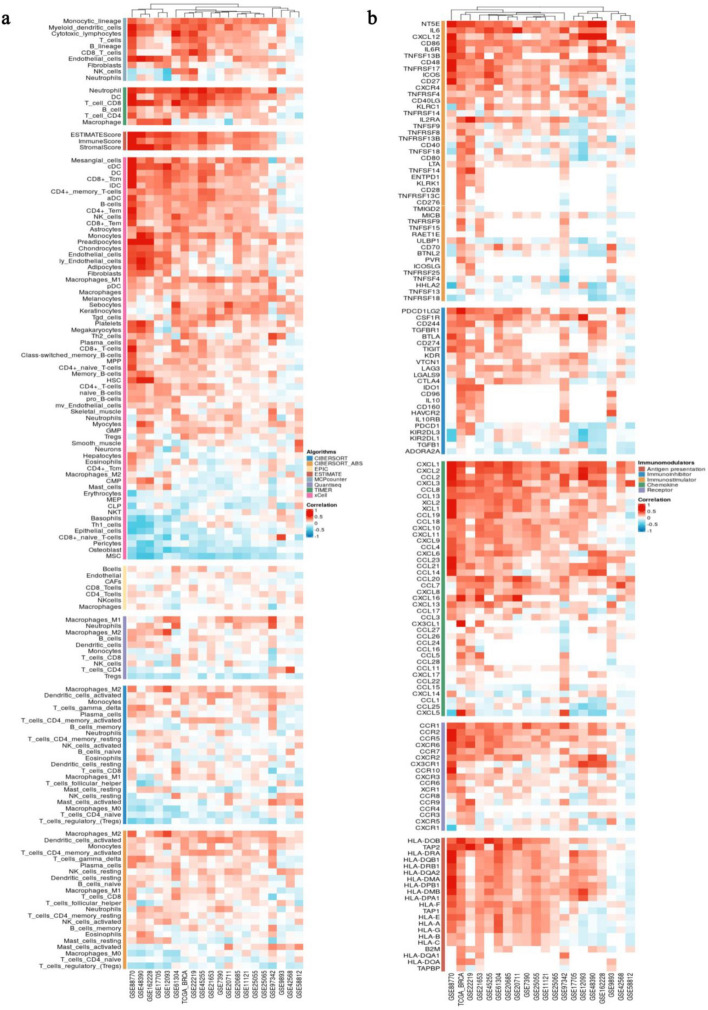
Results: Machine learning methods and LASSO Cox regression were applied to analyze the relationship between gene expression and BC survival. PLA2G4A was identified as a key gene associated with cancer prognosis, supported by analyses of differential gene expression, survival outcomes, single nucleotide variations (SNVs), and copy number variations (CNVs). Biological pathway analyses through KEGG, GO, and GSEA highlighted PLA2G4A's involvement in key cancer-related processes. In vitro studies, including cell scratch assays, Transwell migration assays, and EdU proliferation tests, demonstrated that overexpression of PLA2G4A inhibited the proliferation and migration of BC cells.

Conclusions: PLA2G4A plays a crucial role in the progression of BC, acting as a potential tumor-suppressor gene. The findings support its potential as a prognostic biomarker and further investigation is needed to explore its therapeutic potential in clinical settings.

Keywords: Bioinformatics; Breast neoplasm; Cancer; Machine learning; PLA2G4A; Platelet-related exosomes.


Conflict of interest statement

Declarations. Ethics approval and consent to participate: Not applicable. Consent for publication: Not applicable. Competing interests: The authors declare no competing interests.

Figures

Fig. 1
Fig. 1
The flowchart of this study
Fig. 2
Fig. 2
Selection of PRE-related genes and exploration of the biological pathways they are involved in: a Venn diagram of exosome-related genes and platelet-related genes, yielding 44 common genes; b, c Functional and network prediction of proteins related to common genes; d) KEGG pathway enrichment analysis. The Sankey diagram lists related genes on the left and their enriched pathways on the right, with the thickness of the connections representing the relationship between different genes and pathways. The bubble chart shows the enrichment factor of each pathway, with the size of the bubbles indicating the number of genes in the pathway, and the color representing the P-value. The smaller the P-value, the closer the color is to purple, indicating higher significance
Fig. 3
Fig. 3
Selection and predictive modeling of BC survival-associated genes: a, b 13 survival-related genes identified from 44 PRF-associated genes using the LASSO logistic regression model; c Residual box plots of ten machine learning models; d Importance ranking of each gene in 10 machine learning models, with only the top 10 shown in the graph; e The reverse cumulative distribution graph of residuals; f The AUC values for 10 machine learning models based on ROC curves
Fig. 4
Fig. 4
Expression and genetic characteristics of the most relevant genes: a The petal diagram of the 4 genes intersecting among the top 10 importance-ranked genes across ten machine learning models; b A box plot of the expression levels of the 4 genes in normal and tumor tissues; c A bubble chart of the importance of these genes in various prognostic indicators; d A stacked bar chart of the mutation frequency of these 4 genes in the samples; e The proportion of single nucleotide variations (SNVs) for the 4 genes; f The heterozygous copy number variation status of the 4 genes; g The homozygous copy number variation status of the 4 genes
Fig. 5
Fig. 5
Alterations in methylation patterns and their impact on PLA2G4A expression: a Correlation between mRNA expression levels of 4 key genes and methylation; b Difference in methylation levels of PLA2G4A between normal individuals and BC patients; c Analysis of the correlation between mRNA expression levels of PLA2G4A and methylation
Fig. 6
Fig. 6
Genetic mutation characteristics induced by the APOBEC enzyme family in BRCA: a A summary of 5 mutation characteristics identified in the TCGA-BRCA cohort, each subplot representing a distinct mutation characteristic, offering the most similar reference feature and associated biological pathways; b A pie chart of the relative abundance of each mutation characteristic in the TCGA cohort, with each mutation feature assigned a unique color code; c A scatter plot of the correlation between the abundance of the APOBEC signature and APOBEC mutation scores (AMEs), with the trend line suggesting a positive relationship; d A bar chart of the relationship between TCW mutations and AMEs levels, showing that TCW mutations significantly increased with higher AMEs levels; e The importance of the four genes PLA2G4A, CRK, JAK1, and JUN in TCW mutations; f The importance of the four genes PLA2G4A, CRK, JAK1, and JUN in AMEs
Fig. 7
Fig. 7
Pan-cancer analysis of PLA2G4A and its expression in six immune subtypes: a The expression of PLA2G4A in various organ cell lines; b The expression of PLA2G4A in pan-cancer; c The pan-cancer immunohistochemical expression of PLA2G4A in the HPA database; d The depmap CRISPR score of PLA2G4A in pan-cancer, with a negative value indicating that CRISPR-Cas9 knockout of the target gene led to growth arrest or death of the cell line; e The relationship between the expression levels of PLA2G4A and common immune subtypes
Fig. 8
Fig. 8
Impact of PLA2G4A expression on BC survival and its distribution in normal and tumor tissues. AG show survival curves for BC patients with high PLA2G4A expression (red dashed line) and low PLA2G4A expression (blue solid line) across different cohorts. Analyses include Overall Survival (OS), Relapse-free Survival (RFS), and Disease-free Survival (DFS), with all P-values < 0.05. HJ illustrate the distribution of PLA2G4A expression in normal tissue (blue) versus tumor tissue (red), with P-values < 0.001
Fig. 9
Fig. 9
The scRNA-seq analysis of PLA2G4A expression. a Pan-cancer scRNA-seq analysis of PLA2G4A across 28 common tumor types. b The scRNA-seq analysis of PLA2G4A in BC. (Rows represent different datasets, with the same disease type assigned the same label color. Columns correspond to various cell types. The color bar on the right serves as the scale for the relationship between data values and colors, illustrating the intensity of expression. The darker the color (red), the higher the expression level. White indicates either no expression or the absence of the respective cell type in the dataset
Fig. 10
Fig. 10
Inhibition of BC progression by PLA2G4A a Western blot analysis of PLA2G4A protein expression was performed on five different BC cell lines and untransformed MCF10A cells. b Overexpression of PLA2G4A in these cells was verified by qRT-PCR after transfection of SKBR3 with Pcdh-cmv-mcs-ef1-copGFP-T2A-Puro. c EdU incorporation assays were performed to assess the DNA synthesis rate. To confirm the effect of PLA2G4A overexpression on cell migration and invasion, wound healing d and transwell invasion e assays were performed
Fig. 11
Fig. 11
KEGG and GO pathway enrichment analysis of differential genes in high and low expression groups of PLA2G4A: a KEGG pathway enrichment for differential genes in high and low expression groups of PLA2G4A; b GO pathway enrichment for differential genes in high and low expression groups of PLA2G4A (red and blue indicate high and low expression groups, respectively)
Fig. 12
Fig. 12
GSEA enrichment analysis: a GSEA-KEGG analysis for high and low expression groups of PLA2G4A; b GSEA-GO analysis for high and low expression groups of PLA2G4A (scores above 0 indicate enrichment in the high expression group)
Fig. 13
Fig. 13
Immunological features of PLA2G4A: a Correlation between PLA2G4A and various immune cells across different datasets (calculated using 8 different algorithms); b Correlation between PLA2G4A and various immune characteristics in different datasets
Fig. 14
Fig. 14
Analysis of anticancer drug sensitivity for PLA2G4A in 4 different databases: a Drug sensitivity analysis of PLA2G4A based on the GDSC V1 database; b Drug sensitivity analysis of PLA2G4A based on the GDSC V2 database; c Drug sensitivity analysis of PLA2G4A based on the CTRP database; d Drug sensitivity analysis of PLA2G4A based on the PRISM database
Fig. 15
Fig. 15
Molecular docking results of key active components with the target genes: a Small molecule compounds sensitive to PLA2G4A; b The target genes for 4 small molecule drugs; c Docking of Darapladib with PLA2G4A-related protein, with a binding energy of 2216.3 kcal/mol; d Docking of Fluticasone propionate with PLA2G4A-related protein, with a binding energy of − 6.4 kcal/mol; e Docking of Niflumic Acid with PLA2G4A-related protein, with a binding energy of − 5.9 kcal/mol; f Docking of Quinacrine with PLA2G4A-related protein, with a binding energy of − 5.2 kcal/mol

Similar articles

References

    1. Sung H, Ferlay J, Siegel RL, Laversanne M, Soerjomataram I, Jemal A, et al. Global Cancer statistics 2020: GLOBOCAN estimates of incidence and mortality worldwide for 36 cancers in 185 countries. CA A Cancer J Clin. 2021;71(3):209–49. 10.3322/caac.21660. - PubMed
    1. Burstein HJ, Curigliano G, Thürlimann B, Weber WP, Poortmans P, Regan MM, et al. Customizing local and systemic therapies for women with early breast cancer: the St. Gallen International Consensus Guidelines for treatment of early breast cancer 2021. Ann Oncol. 2021;32(10):1216–35. 10.1016/j.annonc.2021.06.023. - PMC - PubMed
    1. Gradishar WJ, Moran MS, Abraham J, Aft R, Agnese D, Allison KH et al. Breast cancer, version 3.2022, NCCN clinical practice guidelines in oncology. JNCCN. 2022;20(6):691–722. 10.6004/jnccn.2022.0030. - PubMed
    1. Kawiak A. Molecular research and treatment of breast cancer. Int J Mol Sci. 2022. 10.3390/ijms23179617. - PMC - PubMed
    1. Li S, Lu Z, Wu S, Chu T, Li B, Qi F, et al. The dynamic role of platelets in cancer progression and their therapeutic implications. Nat Rev Cancer. 2024;24(1):72–87. 10.1038/s41568-023-00639-6. - PubMed

LinkOut - more resources