. 2025 Jul 7;8(1):958.
doi: 10.1038/s42003-025-08334-y.

Dynamicasome-a molecular dynamics-guided and AI-driven pathogenicity prediction catalogue for all genetic mutations

Affiliations

Dynamicasome-a molecular dynamics-guided and AI-driven pathogenicity prediction catalogue for all genetic mutations

Naeyma N Islam et al. Commun Biol. .

Abstract

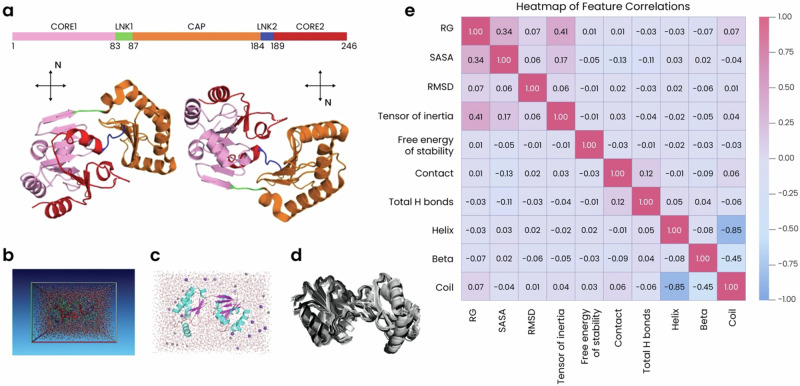
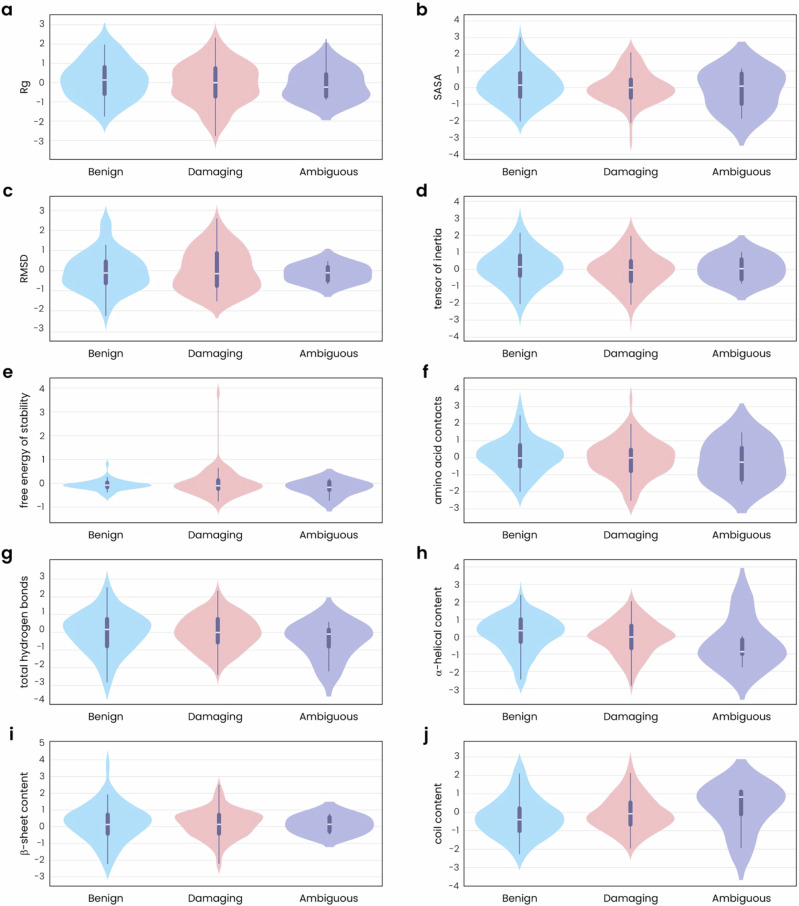
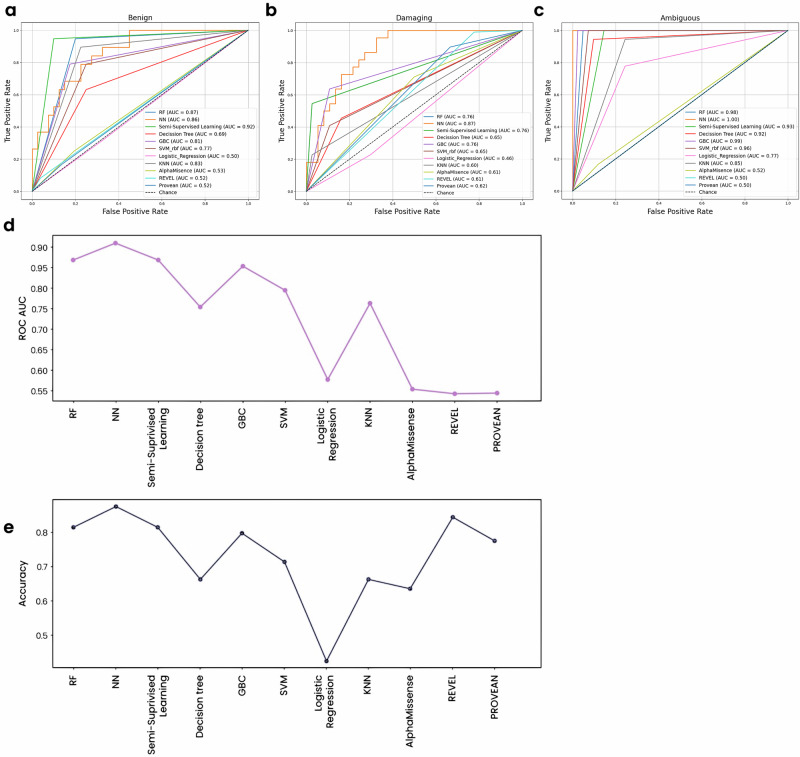
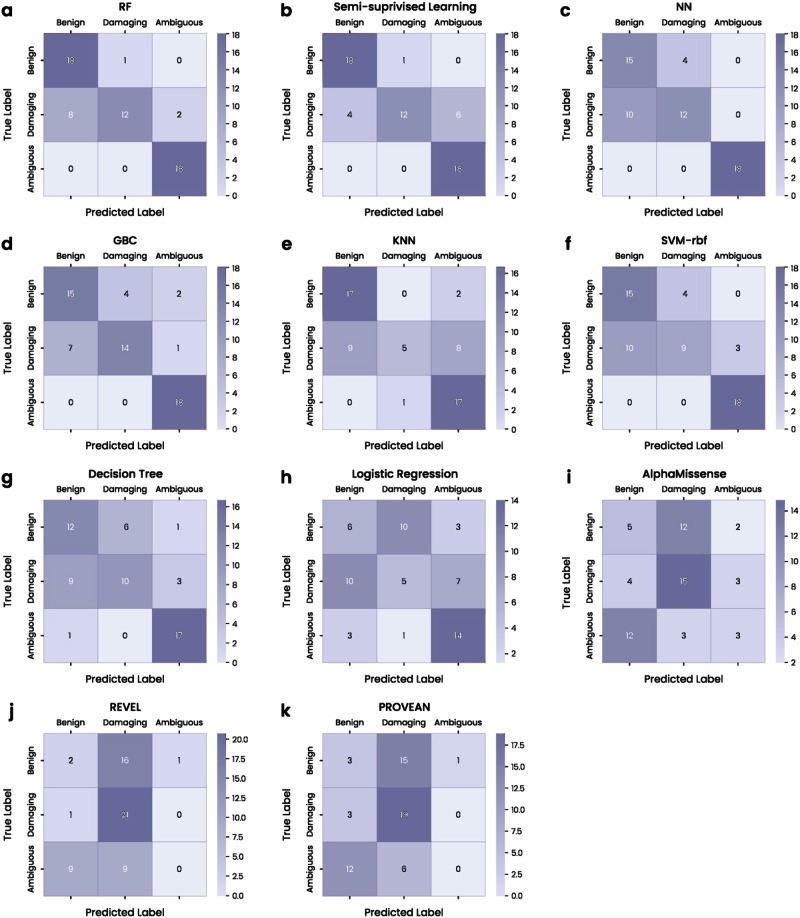
Advances in genomic medicine accelerate the identification of mutations in disease-associated genes, but the pathogenicity of many mutations remains unknown, hindering their use in diagnostics and clinical decision-making. Predictive AI models are generated to combat this issue, but current tools display low accuracy when tested against functionally validated datasets. We show that integrating detailed conformational data extracted from molecular dynamics simulations (MDS) into advanced AI-based models increases their predictive power. We carry out an exhaustive mutational analysis of the disease gene PMM2 and subject structural models of each variant to MDS. AI models trained on this dataset outperform existing tools when predicting the known pathogenicity of mutations. Our best performing model, a neuronal networks model, also predicts the pathogenicity of several PMM2 mutations currently considered of unknown significance. We believe this model helps alleviate the burden of unknown variants in genomic medicine.


Conflict of interest statement

Competing interests: The authors declare no competing interests.

Figures

Fig. 1
Fig. 1. Features extracted from MDS of PMM2 variants show a range of correlations.
a Structural map of wildtype PMM2 shown in two rotations. Domains are color-coded according to the schematic above and include a CAP domain involved in dimerization and activator binding (orange) and two CORE domains (pink and red) involved in binding catalytic and structural Mg2+ ions. Two linker (LNK) domains (green and blue) provide flexibility, which enables motions necessary for catalysis. b,c MDS were run in a closed system (b) in a simulated physiological environment (c). Water molecules are depicted as red and white sticks, Na+ ions as gray spheres, and Cl- ions as purple spheres. PMM2 is color-coded by secondary structure, with α-helices in blue, β-sheets in magenta, and loops or coils in salmon. d 20 conformations of wildtype PMM2 overlaid upon each other demonstrate dynamics throughout the simulation. Gray darkness increases as the simulation progresses. e Heatmap of correlations between MDS features. The color scale ranges from −1.00 (blue), indicating a perfect negative correlation, to 1.00 (red), indicating a perfect positive correlation.
Fig. 2
Fig. 2. MDS features show more narrow distributions with benign mutations and increased variability with damaging and ambiguous mutations.
Violin plots showing the distribution patterns of a Rg, b SASA, c RMSD, d the tensor of inertia, e the free energy of stability, f the number of amino acids within 0.5 Å of one another, g the total number of hydrogen bonds, h the percent of α-helical content, i the percent of β-sheet content, and j the percent of coil content in datasets of benign (blue), damaging (pink), and ambiguous (purple) PMM2 mutations. All feature values were scaled for comparison.
Fig. 3
Fig. 3. Advanced AI models outperform benchmark and traditional approaches when classifying benign, damaging, and ambiguous PMM2 mutations.
a ROC plots for each model when classifying benign PMM2 mutations. AUCs (highest to lowest): SSL: 0.92, RF: 0.87, DNN: 0.86, KNN: 0.83, GBC: 0.81, SVM-rbf: 0.77, DT: 0.69, AlphaMissense: 0.53, REVEL: 0.52, PROVEAN: 0.52, logistic regression: 0.50. b ROC plots for each model when classifying damaging PMM2 mutations. AUCs (highest to lowest): DNN: 0.87, RF: 0.76, semi-supervised learning: 0.76, GBC: 0.76, SVM-rbf: 0.65, DT: 0.65, PROVEAN: 0.62, AlphaMissense: 0.61, REVEL: 0.61, KNN: 0.60, logistic regression: 0.46. c ROC plots for each model when classifying ambiguous PMM2 mutations. AUCs (highest to lowest): DNN: 1.00, GBC: 0.99, RF: 0.98, SVM-rbf: 0.96, semi-supervised learning: 0.93, DT: 0.92, KNN: 0.85, logistic regression: 0.77, AlphaMissense: 0.52, REVEL: 0.50, PROVEAN: 0.50. d Average ROC-AUC values across all three mutation classes for each model. e Accuracy of each model across all three mutation classes.
Fig. 4
Fig. 4. Confusion matrices highlight the relative success of different models when classifying different classes of PMM2 mutations.
The number of mutations predicted to be of each class (benign, damaging, or ambiguous) is plotted against the true labels, so that each matrix shows the number of true positive, false positive, false negative, and true negative predictions for the advanced AI models: a RF, b SSL, c DNN, d GBC, e KNN, f SVM-rbf, and g DT. Matrices are also shown for LR (h) and the three benchmark models, i AlphaMissense, j REVEL, and k PROVEAN. Darker shades indicate higher counts.
Fig. 5
Fig. 5. Ranking of features by their contribution to the performance of advanced AI models reveals that RMSD is the most important factor when predicting PMM2 mutations.
The importance of each feature to the performance of our advanced AI models is plotted by percentage.
Fig. 6
Fig. 6. Predictive models show varying outcomes when classifying PMM2 mutations of unknown significance.
a The bar graph illustrates the percentage distribution of predictions for each category (benign in blue, damaging in orange, ambiguous in green) across the indicated models. b Comparative analysis of DNN model predictions versus the predictions of benchmark models AlphaMissense, REVEL, and PROVEAN. When a mutation was predicted as benign or damaging by the DNN model and at least one benchmark model, they were categorized as a match: matched benign mutations are in blue and matched damaging mutations in orange. Predictions made by the DNN model that were not called by any benchmark models are labeled as “No Match Benign” in green and “No Match Damaging” in red.

Similar articles

References

    1. Richards, S. et al. Standards and guidelines for the interpretation of sequence variants: a joint consensus recommendation of the American College of Medical Genetics and Genomics and the Association for Molecular Pathology. Genet. Med.17, 405–424 (2015). - PMC - PubMed
    1. Baldridge, D. et al. The Exome Clinic and the role of medical genetics expertise in the interpretation of exome sequencing results. Genet. Med.19, 1040–1048 (2017). - PMC - PubMed
    1. Hopkins, C. E., Brock, T., Caulfield, T. R. & Bainbridge, M. Phenotypic screening models for rapid diagnosis of genetic variants and discovery of personalized therapeutics. Mol. Asp. Med.91, 101153 (2023). - PMC - PubMed
    1. Wagner, J. K. & Meyer, M. N. Genomic medicine and the “loss of chance” medical malpractice doctrine. HGG Adv.2, 1–9 (2021). - PMC - PubMed
    1. OMIM. in Online Mendelian Inheritance in Man OMIM® (McKusick-Nathans Institute of Genetic Medicine, Johns Hopkins University, Baltimore, MD.

Substances

LinkOut - more resources