

Time-dependent microbiome dynamics in orthodontic thermoplastic materials: comparing PETG and TPU
- PMID: 40624404
- PMCID: PMC12234582
- DOI: 10.1007/s00784-025-06441-y
Time-dependent microbiome dynamics in orthodontic thermoplastic materials: comparing PETG and TPU
Abstract
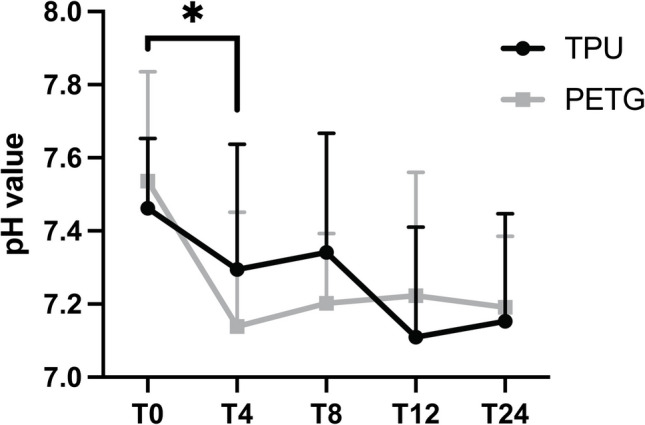
Objectives: This study compares the effects of thermoplastic polyurethane (TPU) and polyethylene terephthalate glycol (PETG) aligners on the oral microbiome and salivary pH during orthodontic treatment.
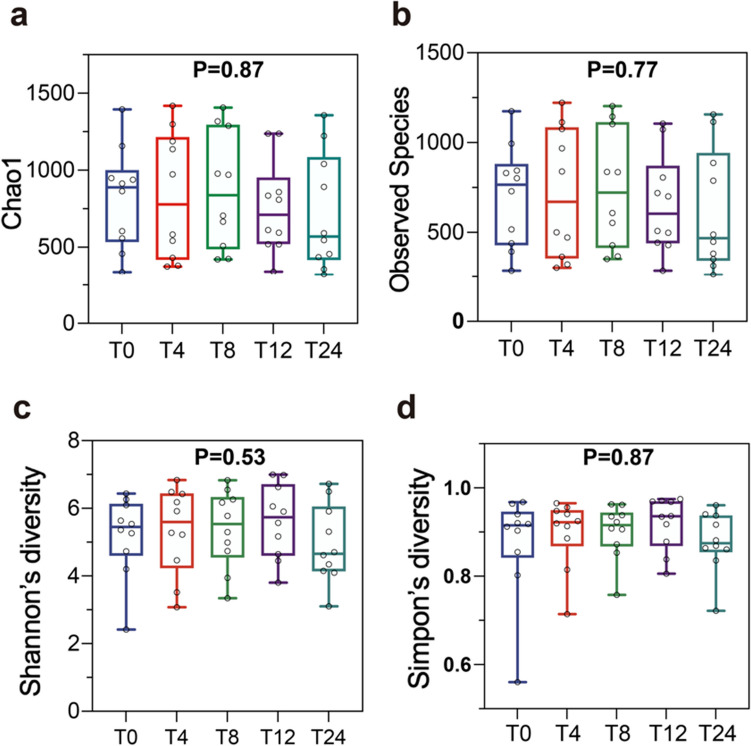
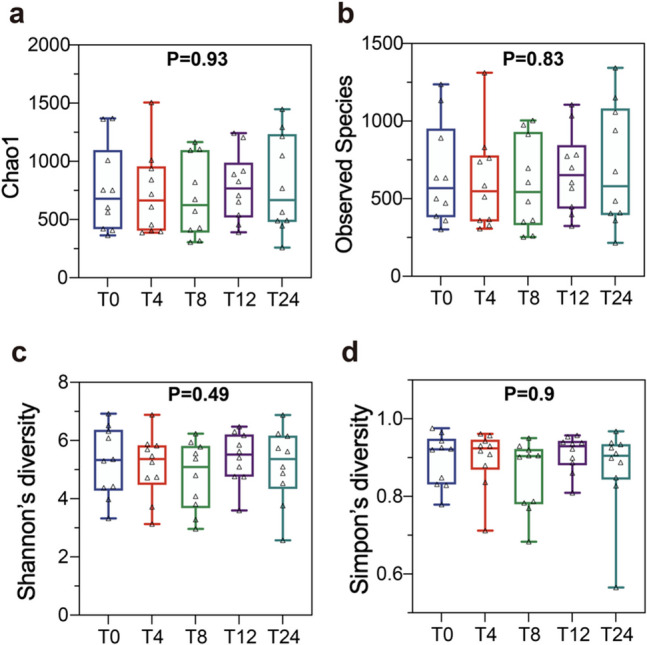
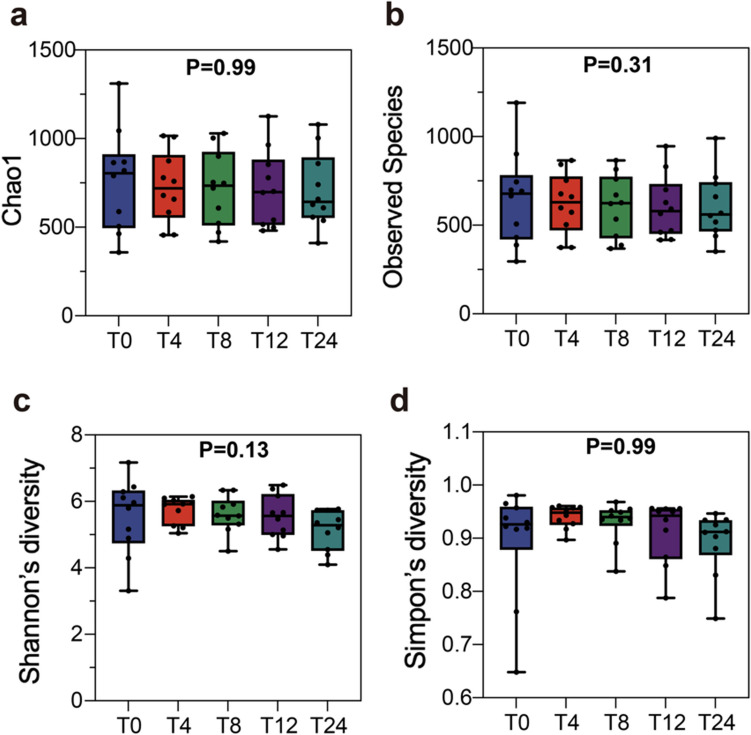
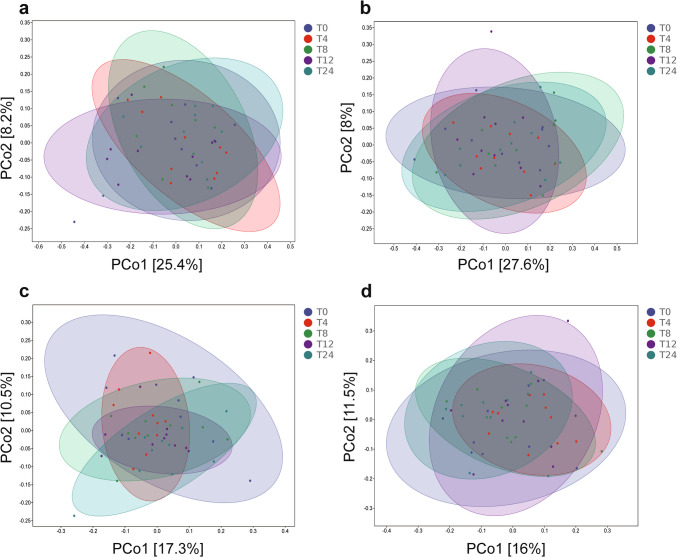
Materials and methods: Ten participants wore TPU and PETG aligners for 24 h. At five time points (1 min, 4, 8, 12, and 24 h), saliva was collected for pH analysis, and microbial samples were taken from both aligner and supragingival plaque surfaces for 16S rRNA sequencing. Statistical analyses included repeated Measures ANOVA for pH, Kruskal-Wallis test for alpha diversity, PERMANOVA for beta diversity, and two-way ANOVA for microbial composition.
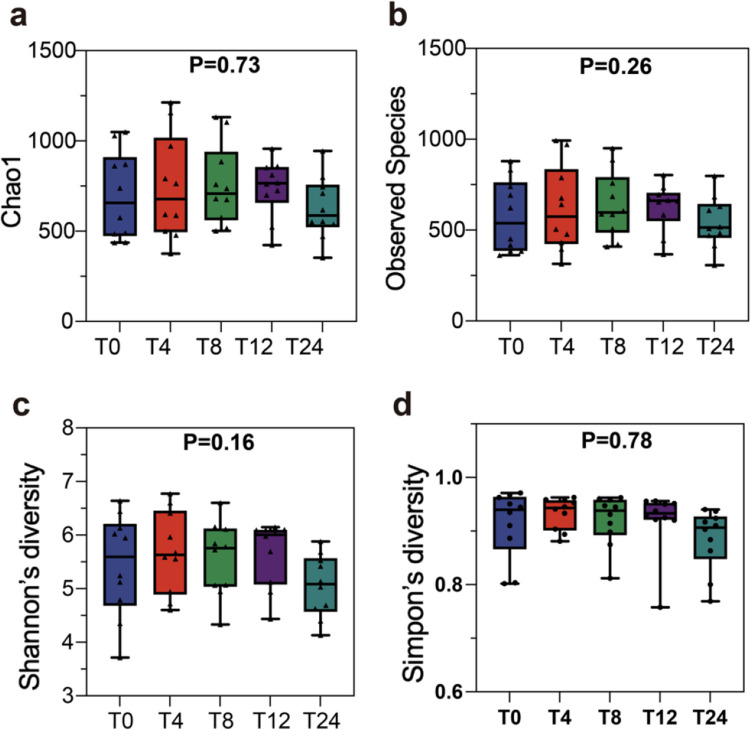
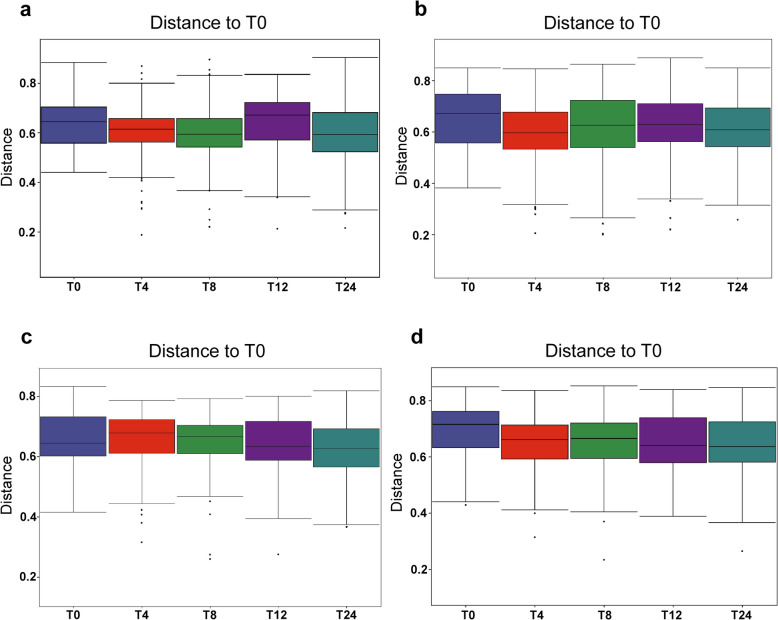
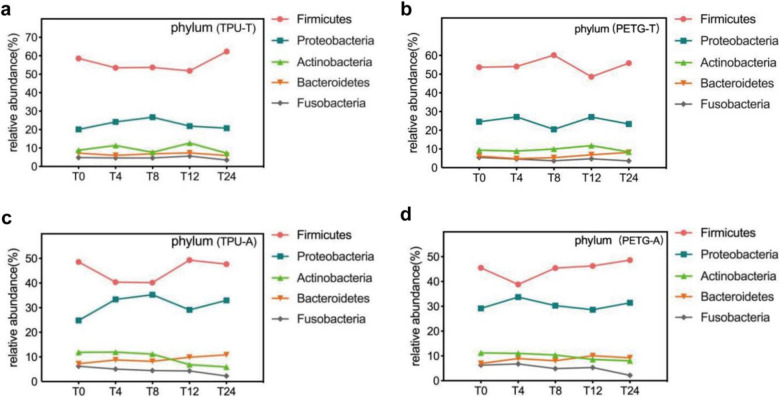
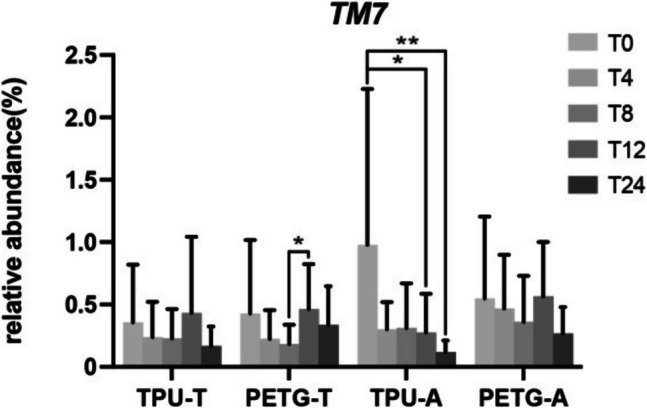
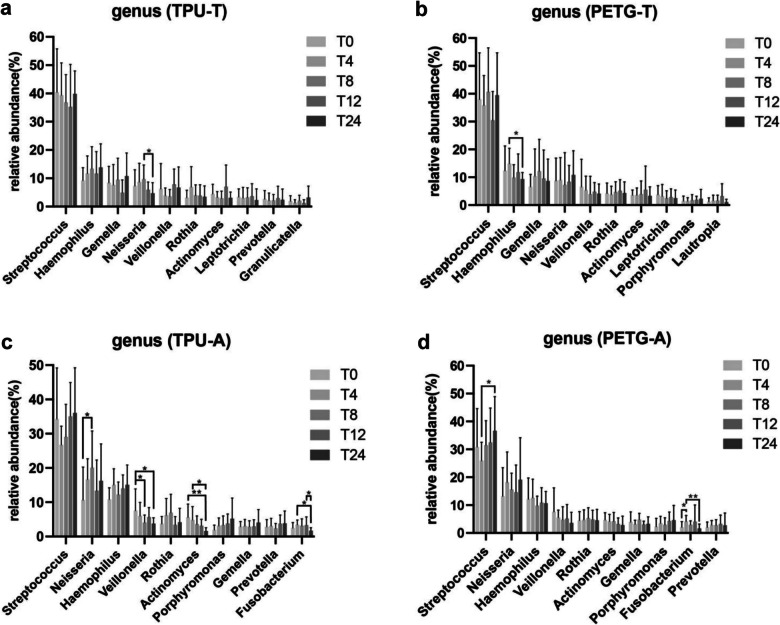
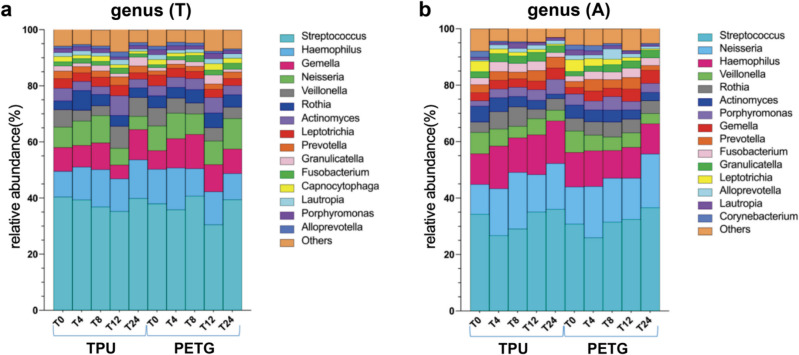
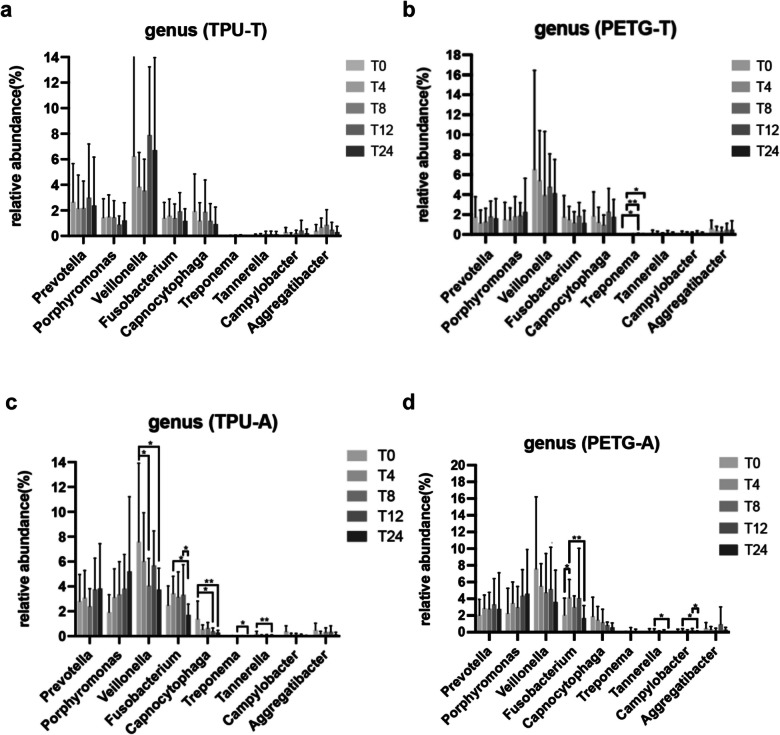
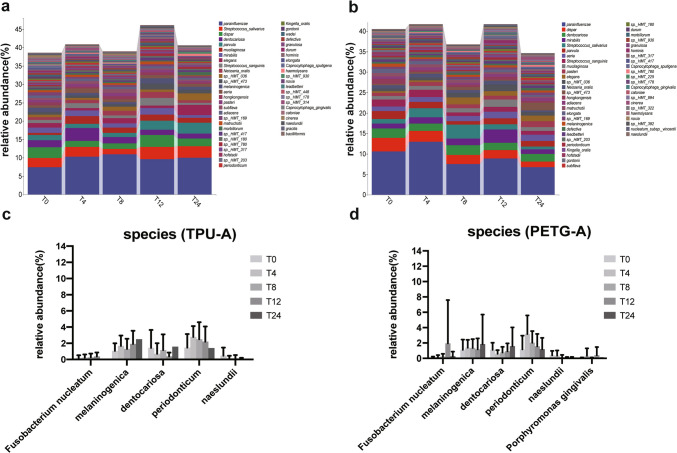
Results: In Group PETG, salivary pH significantly decreased from T0 to T4 (p < 0.05). No significant changes in alpha or beta microbiota diversity were observed in either group. Microbial shifts in supragingival plaque microbiomes were detected at T8 in Group PETG, while in Group TPU, these changes became evident between T12 and T24. In aligner microbiomes, Group TPU showed significant reductions in Veillonella, Actinomyces, and Fusobacterium at T24 (p < 0.05). In contrast, Group PETG exhibited significant increases in Streptococcus from T4 to T24 (p < 0.05) and Fusobacterium from T0 to T4 (p < 0.05), followed by a decline from T4 to T24 (p < 0.01).
Conclusions: PETG aligners caused significant reductions in salivary pH at T4 and triggered pronounced fluctuations at T8 in supragingival plaque microbiomes. TPU aligners caused a delayed decline in salivary pH between T8 and T12 and drove distinct structural shifts during prolonged wear from T12 to T24.
Clinical relevance: Material choice based on microbial impact highlights the need for personalized aligner materials and cleaning cycles.
Keywords: 16S Rrna; Clear aligners; Dentistry; Oral microbiome; Orthodontics; Thermoplastic materials.
© 2025. The Author(s).
Conflict of interest statement
Declarations. Ethical approval and informed consent: The research was granted formal ethical approval by the Ethical Committee of the Shanghai Stomatological Hospital on December 28, 2022 (certificate number 2022–019). Verbal informed consent was obtained from all the participants. Conflict of interests: The authors declare no competing interests.
Figures
Similar articles
-
Efficiency of Polyethylene Terephthalate Glycol Thermoplastic Material to Functional and Expansion Forces in Orthodontic Applications: An Experimental Study.ScientificWorldJournal. 2025 Jan 10;2025:7232779. doi: 10.1155/tswj/7232779. eCollection 2025. ScientificWorldJournal. 2025. PMID: 39840371 Free PMC article. Clinical Trial.
-
Oral bacterial community dynamics during induction of gingival inflammation.Front Cell Infect Microbiol. 2025 Jun 16;15:1597690. doi: 10.3389/fcimb.2025.1597690. eCollection 2025. Front Cell Infect Microbiol. 2025. PMID: 40589868 Free PMC article.
-
Color stability of clear aligners exposed to various beverages: an in vitro study.BMC Oral Health. 2025 Jul 1;25(1):971. doi: 10.1186/s12903-025-06343-1. BMC Oral Health. 2025. PMID: 40596984 Free PMC article.
-
EFFECTIVENESS OF CLEAR ORTHODONTIC ALIGNERS IN CORRECTING MALOCCLUSIONS: A SYSTEMATIC REVIEW AND META-ANALYSIS.J Evid Based Dent Pract. 2025 Mar;25(1):102081. doi: 10.1016/j.jebdp.2024.102081. Epub 2024 Dec 16. J Evid Based Dent Pract. 2025. PMID: 39947778
-
Retention procedures for stabilising tooth position after treatment with orthodontic braces.Cochrane Database Syst Rev. 2016 Jan 29;2016(1):CD002283. doi: 10.1002/14651858.CD002283.pub4. Cochrane Database Syst Rev. 2016. Update in: Cochrane Database Syst Rev. 2023 May 22;5:CD002283. doi: 10.1002/14651858.CD002283.pub5. PMID: 26824885 Free PMC article. Updated.
References
-
- Shokeen B, Viloria E, Duong E, Rizvi M, Murillo G, Mullen J et al (2022) The impact of fixed orthodontic appliances and clear aligners on the oral microbiome and the association with clinical parameters: a longitudinal comparative study. Am J Orthod Dentofacial Orthop 161:e475–e485. 10.1016/j.ajodo.2021.10.015 - PubMed
-
- Bozkurt AP, Demirci M, Erdogan P, Kayalar E (2024) Comparison of microbial adhesion and biofilm formation on different orthodontic aligners. Am J Orthod Dentofacial Orthop. 10.1016/j.ajodo.2024.08.010 - PubMed
Publication types
MeSH terms
Substances
Grants and funding
LinkOut - more resources
Full Text Sources
