

Dynamics of respiratory virus transmission in children during and after COVID-19 outbreak control in Baiyin, China
- PMID: 40624459
- PMCID: PMC12235979
- DOI: 10.1186/s12879-025-11285-8
Dynamics of respiratory virus transmission in children during and after COVID-19 outbreak control in Baiyin, China
Abstract
Purpose: We aimed to study the changes in respiratory virus detection rates during the control of the COVID-19 outbreak and to elucidate possible epidemiologic disturbances after the lifting of control measures.
Methods: Severe acute respiratory infection (SARI) specimens were collected from hospitalized children in Baiyin, China, from 2021 to 2023. We conducted real-time fluorescence quantitative PCR (RT-qPCR) to detect various respiratory viruses, including influenza virus (IFV), human respiratory syncytial virus (HRSV), human rhinovirus (HRV), human parainfluenza virus (HPIV), human metapneumovirus (HMPV), human adenovirus (HADV), enterovirus (EV), and human coronavirus (HCoV). The results were statistically analyzed using SPSS 26.0 software.
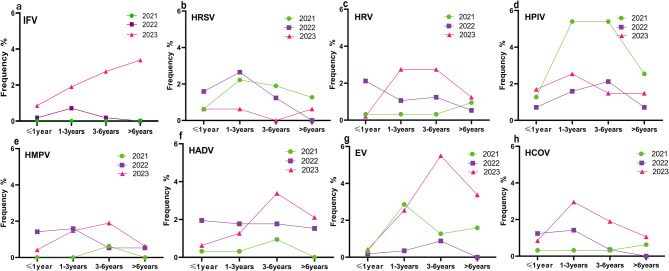
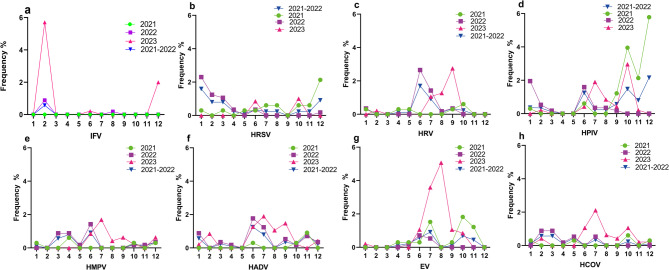
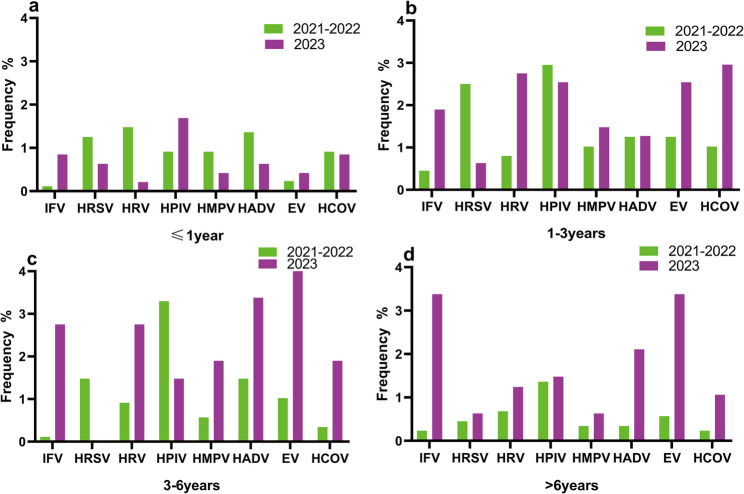
Results: A total of 1353 nasopharyngeal swab specimens were collected from children with SARI between 2021 and 2023. The male-to-female ratio of 1.49:1, the total virus detection rate of 33.85% (458/1353). Data were analyzed by comparing two distinct periods: before the lifting of the COVID-19 control measures (January 1, 2021 - December 6, 2022) and after the lifting of the control measures (December 7, 2022 - December 31, 2023). During the three-year study period, there was no significant difference in the detection rate of pathogen positivity between the ≤ 1 year (OR: 0.986, 95% CI: 0.960-1.013) and 1-3 years (OR: 1.018, 95% CI: 0.997-1.060) age groups (P > 0.05). However, there were significant differences in pathogen positivity rates between the 3-6 years (OR: 1.097, 95% CI: 1.049-1.146) and > 6 years (OR: 1.099, 95% CI: 1.063-1.138) age groups (P < 0.05). Significant differences in pathogen positivity rates were observed between male (OR: 1.293, 95% CI: 1.156-1.445) and female (OR: 1.354, 95% CI: 1.157-1.583) children (P < 0.05). The positive detection rates for various viruses showed a decreasing trend in January and February 2023; however, IFV showed a significant rebound in 2023. Following the lifting of COVID-19 control measures, the overall positive detection rate for respiratory viruses increased significantly from 27.84 to 45.03% (OR: 1.313, 95% CI: 1.198-1.438) (P < 0.05). Prior to the lifting of control measures, the ranking of positive detection rates for respiratory viruses in children was as follows: HPIV > HRSV > HADV > HRV > HMPV > EV > HCOV > influenza virus (IFV). After the measures were lifted, the order was as follows: EV > IFV > HADV > HCOV > HPIV > HRV > HMPV > HRSV. The peak detection periods for HRV, HMPV, HADV, and EV shifted to later time points compared to those before the measures were lifted. After the lifting of control measures, the positive detection rates of IFV (OR: 1.090, 95% CI: 1.059-1.122), EV (OR: 1.102, 95% CI: 1.064-1.141), HCOV (OR: 1.043, 95% CI: 1.017-1.070), and HADV (OR: 1.028, 95% CI: 0.999-1.059) all significantly increased (P < 0.05); HRV (OR: 1.019, 95% CI: 0.994-1.044) and HMPV (OR: 1.010, 95% CI: 0.989-1.032) showed non-significant increases in positive detection rates (P > 0.05); HRSV (OR: 0.965, 95% CI: 0.946-0.985) was significantly reduced (P < 0.05), while the positive detection rate for HPIV (OR: 0.971, 95% CI: 0.943-1.001) showed no significant decrease(P > 0.05).
Conclusions: These findings help clarify that social interventions can influence the prevalence of respiratory viruses in children during unique historical periods. The implementation of COVID-19 control measures may have curbed the spread of respiratory viruses in children during the study period. After the lifting of control measures, monitoring of respiratory pathogens must be strengthened to reduce the harm caused by respiratory viruses to children's health.
Keywords: Children; Coronavirus disease 2019; Preventive and control measures; Respiratory viruses.
© 2025. The Author(s).
Conflict of interest statement
Declarations. Ethics approval and consent to participate: This study was approved by the Ethical Committee of Gansu Provincial Center for Disease Control and Prevention, and carried out strictly in accordance with the Declaration of Helsinki. Informed consent was obtained from all participants and from their legal guardians who were aged ≤ 16 years. Data were stored and analyzed anonymously. Inclusion criteria: ① age ≤ 16 years old; ② symptoms consistent with acute infection (at least one of the following): fever, chills, abnormal white blood cell distribution count (decreased or increased 5.0 × 10^9/L ~ 12.0 × 10^9/L); ③ clinical symptoms (at least one of the following): runny nose, coughing and sputum, wheezing, pharyngeal and laryngeal edema or soreness, chest tightness and chest pain, fatigue, abdominal pain and diarrhea. Nasopharyngeal swab specimens were collected by qualified medical staff of the sentinel hospitals in strict accordance with the monitoring program, and case information was collected. Specimens were stored at 4℃ for 24 h after collection and transported to the laboratory, and specimens sent for examination for more than 24 h were stored at -70℃. Constent for publication: Not applicable. Competing interests: The authors declare no competing interests.
Figures
References
-
- WHO. Coronavirus disease 2019 (COVID-19) Situation Report-51 [EB/OL]. (2020-03-11) [2020-03-15]. https://www.who.int/docs/default-source/coronaviruse/situation-reports/2....
-
- World Health Organization. coronavirus disease 2019 (COVID-19) situ-ation report-86. https://www.who.int/publications/i/item/coronavirus-disease-2019-(covid-19). Accessed 20 Nov 2022.
MeSH terms
Grants and funding
LinkOut - more resources
Full Text Sources
Medical
