

Dynamics of contact behaviour by self-reported COVID-19 vaccination and infection status during the COVID-19 pandemic in Germany: an analysis of two large population-based studies
- PMID: 40624510
- PMCID: PMC12235905
- DOI: 10.1186/s12916-025-04211-x
Dynamics of contact behaviour by self-reported COVID-19 vaccination and infection status during the COVID-19 pandemic in Germany: an analysis of two large population-based studies
Abstract
Background: Contact behaviour is crucial to assess and predict transmission of respiratory pathogens like SARS-CoV-2. Contact behaviour has traditionally been assessed in cross-sectional surveys and not as part of longitudinal population-based studies which simultaneously measure infection frequency and vaccination coverage. During the COVID-19 pandemic, several studies assessed contact behaviour over longer periods and correlated this to data on immunity. This can inform future dynamic modelling. Here, we assess how contact behaviour varied based on SARS-CoV-2 infection or vaccination status in two large population-based studies in Germany during 2021.
Methods: We assessed direct encounters, separated into household and non-household contacts, in participants of MuSPAD (n = 12,641), a population-based cohort study, and COVIMOD (n = 31,260), a longitudinal contact survey. We calculated mean numbers of reported contacts and fitted negative binomial mixed-effects models to estimate the impact of immunity status, defined by vaccination or previous infection, on contact numbers; logistic mixed-effects models were used to examine the relationship between contact behaviour and seropositivity due to infection.
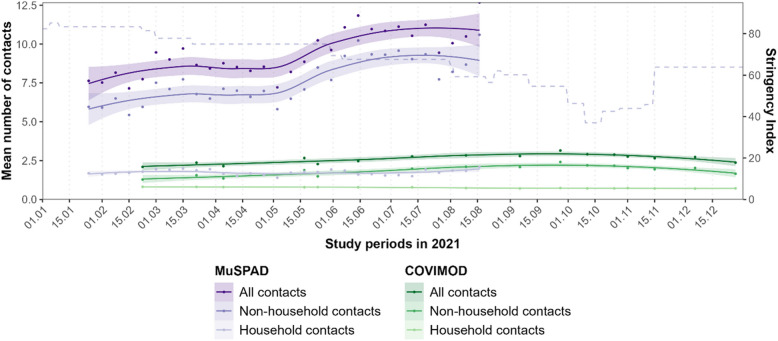
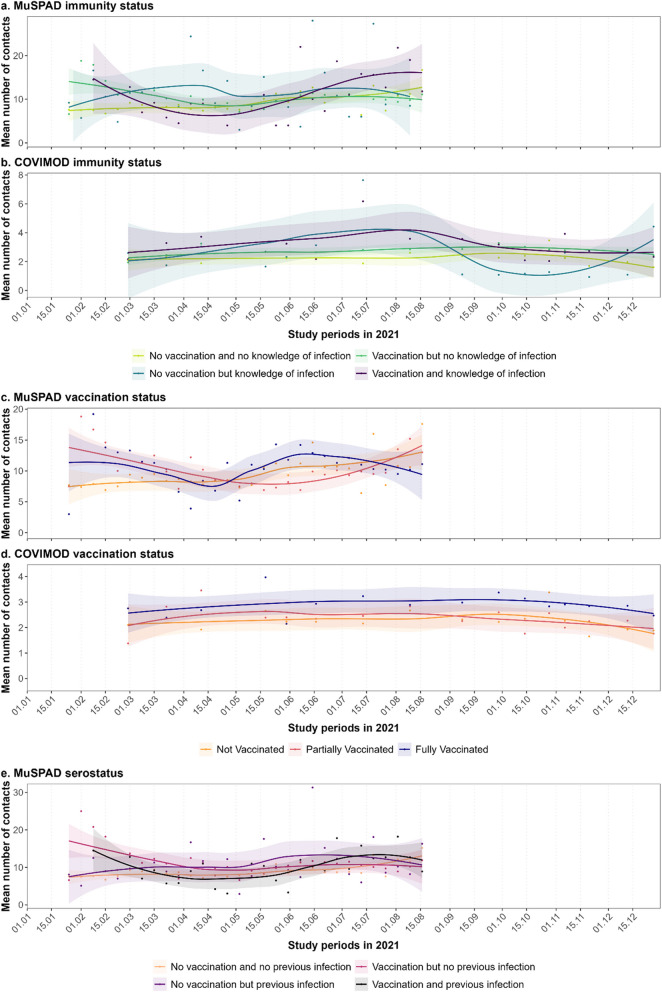
Results: Contact numbers varied over the course of the pandemic from 7.6 to 10.8 per 24 h in MuSPAD and 2.1 to 3.1 per 24 h in COVIMOD. The number of non-household contacts was higher in participants who reported previous infections and vaccinations (contact ratio (CR) MuSPAD: 1.22 (95%CI 0.94-1.60); COVIMOD: 1.35 (CI 1.12-1.62)) compared to unvaccinated and uninfected individuals. Non-household contact numbers were also higher in fully vaccinated participants (MUSPAD: CR 1.15 (CI 1.05-1.26); COVIMOD: 1.43 (CI 1.32-1.56)) compared to unvaccinated individuals. Compared to individuals without household contacts, the odds for seropositivity due to infection were higher among MuSPAD individuals with three or more household contacts (odds ratio (OR) 1.54 (CI 1.12-2.13)) and eleven or more non-household contacts (OR 1.29 (CI 1.01-1.65)).
Conclusions: Different contact behaviours based on infection and/or vaccination status suggest that public health policies targeting immunity status may influence the contact behaviour of those affected. A combined assessment of self-reported contacts, infections, and vaccinations as well as laboratory-confirmed serostatus in the population can support modelling of the spread of infections. This could help target containment policies and evaluate the impact of public health measures.
Keywords: Covid-19; Immunity status; Pandemic; Previous infections; SARS-CoV-2; Seroprevalence study; Social contact behaviour; Social contact survey; Vaccination status.
© 2025. The Author(s).
Conflict of interest statement
Declarations. Ethics approval and consent to participate: Primary data of the MuSPAD study were recorded for research purposes. The study was approved by the Ethics Committee of the Hannover Medical School on 21.6.2020 prior to the implementation of the survey phase, taking into account data security issues in accordance with the EU General Data Protection Regulation (GDPR) (granted ethics vote number “9086_BO_S_2020”). At the time of enrolment, written consent was obtained from the study participants after detailed information and explanation of the scope and objectives of the study, before the actual data and sample collection took place. The responsible ethics committees for NAKO (Bavarian Medical Association “Bayerische Landesärztekammer” [13023, 13031] and Medical Association of Lower Saxony “Ärztekammer Niedersachen” [Grae/067/2013]) approved all NAKO-related human examinations. COVIMOD was approved by the ethics committee of the Medical Board Westfalen-Lippe and the University of Münster, reference number 2020-473-f-s. Informed consent was obtained from all COVIMOD participants. Consent for publication: Not applicable. Competing interests: The authors declare the following competing interests: Stefan Scholz (COVIMOD Consortium Group member) is currently an employee of Moderna Germany GmbH, Munich, Germany. The other authors declare that they have no competing interests.
Figures


References
-
- World Health Organisation. WHO announces COVID-19 outbreak a pandemic. https://www.euro.who.int/en/health-topics/health-emergencies/coronavirus.... Accessed 9 Feb 2022.
MeSH terms
Substances
Grants and funding
- 01KX2121/Bundesministerium für Bildung und Forschung
- 01KX2121/Bundesministerium für Bildung und Forschung
- 01KX2021/Bundesministerium für Bildung und Forschung
- MV2021-012/Bundesministerium für Bildung und Forschung
- 01KX2121/Bundesministerium für Bildung und Forschung
- 01KX2021/Bundesministerium für Bildung und Forschung
- 01KX2121/Bundesministerium für Bildung und Forschung
- SO-096HZEPiAdHoc & LOKI: KA1-Co-08/Helmholtz Association
- SO-096HZEPiAdHoc & LOKI: KA1-Co-08/Helmholtz Association
- 101003480; 10107382; 101095606/European Union's Horizon 2020 research and innovation program
- 101003480; 10107382; 101095606/European Union's Horizon 2020 research and innovation program
- 458526380/Deutsche Forschungsgemeinschaft
- 458526380/Deutsche Forschungsgemeinschaft
- 458526380/Deutsche Forschungsgemeinschaft
LinkOut - more resources
Full Text Sources
Medical
Miscellaneous
