. 2025 Jul 7;23(1):748.
doi: 10.1186/s12967-025-06829-0.

SMPDL3B a novel biomarker and therapeutic target in myalgic encephalomyelitis

Affiliations

SMPDL3B a novel biomarker and therapeutic target in myalgic encephalomyelitis

Bita Rostami-Afshari et al. J Transl Med. .

Erratum in

Abstract

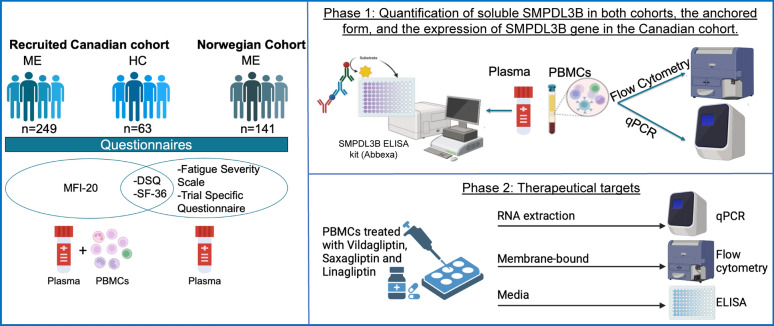
Background: Sphingomyelin phosphodiesterase acid-like 3B (SMPDL3B) is emerging as a potential biomarker and therapeutic target in myalgic encephalomyelitis (ME), a complex multisystem disorder characterized by immune dysfunction, metabolic disturbances, and persistent fatigue. This study investigates the role of SMPDL3B in ME pathophysiology and explores its clinical relevance.

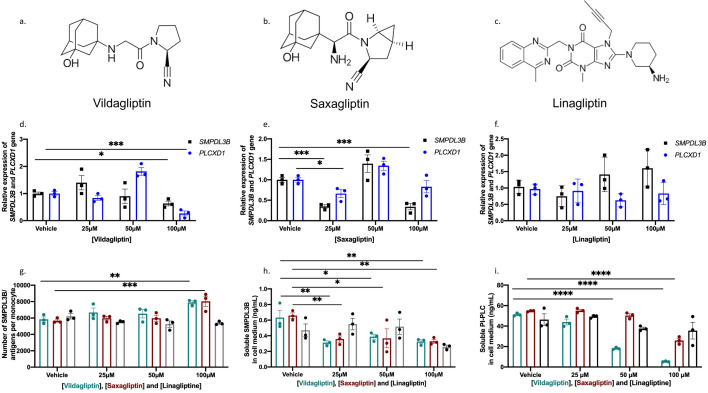
Methods: A case-control study was conducted in two independent cohorts: a Canadian cohort (249 ME patients, 63 controls) and a Norwegian replication cohort (141 ME patients). Plasma and membrane-bound SMPDL3B levels were quantified using ELISA and flow cytometry. Gene expression of SMPDL3B and PLCXD1, encoding phosphatidylinositol-specific phospholipase C (PI-PLC), was analyzed by qPCR. The effects of dipeptidyl peptidase-4 (DPP-4) inhibitors-vildagliptin, saxagliptin, and linagliptin-on modulation of membrane-bound and soluble SMPDL3B were assessed in vitro by qPCR, flow cytometry and ELISA.

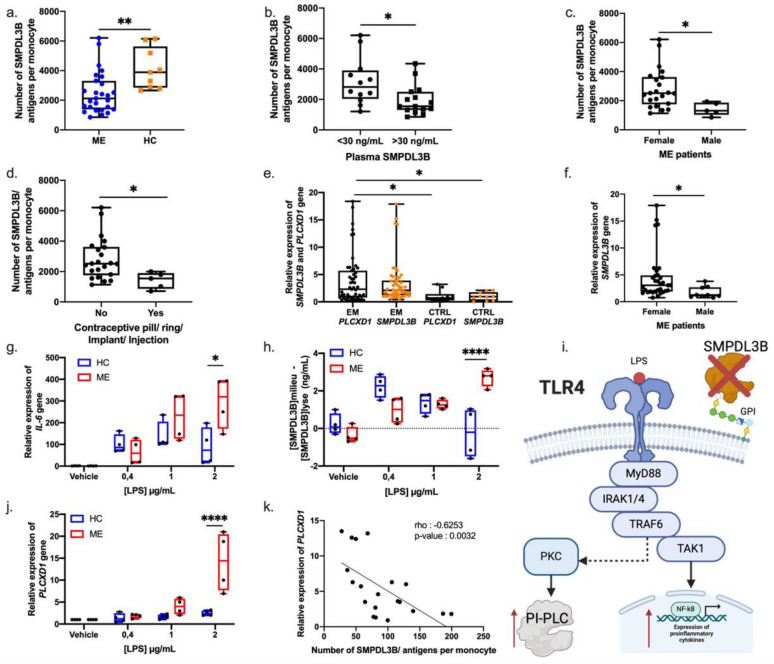
Results: ME patients exhibited significantly elevated plasma SMPDL3B levels, which correlated with symptom severity. Flow cytometry revealed a reduction in membrane-bound SMPDL3B in monocytes, accompanied by increased PLCXD1 expression and elevated plasma levels of PI-PLC and SMPDL3B. These findings suggest that immune dysregulation in ME may be linked to enhanced cleavage of membrane-bound SMPDL3B by PI-PLC. Sex-specific differences were observed, with female ME patients displaying higher plasma SMPDL3B levels, an effect influenced by estrogen. In vitro, estradiol upregulated SMPDL3B expression, indicating hormonal regulation. Vildagliptin and saxagliptin were tested for their potential to inhibit PI-PLC activity independently of their role as DPP-4 inhibitors, and restored membrane-bound SMPDL3B while reduced its soluble form.

Conclusions: SMPDL3B emerges as a key biomarker for ME severity and immune dysregulation, with its activity influenced by hormonal and PI-PLC regulation. The ability of vildagliptin and saxagliptin to preserve membrane-bound SMPDL3B and reduce its soluble form via PI-PLC inhibition suggests a novel therapeutic strategy. These findings warrant clinical trials to evaluate their potential in mitigating immune dysfunction and symptom burden in ME.

Keywords: Myalgic encephalomyelitis (ME); Phosphatidylinositol-specific phospholipase C (PI-PLC); Saxagliptin; Sphingomyelin phosphodiesterase acid-like 3b (SMPDL3B); Vildagliptin.


Conflict of interest statement

Declarations. Ethics approval and consent to participate: The study was conducted in accordance with the Declaration of Helsinki, and approved by the Institutional Review Board of CHU Sainte-Justine (protocol #4047). Informed consent was obtained from all participants involved in the study. Consent for publication: Not applicable. Competing interests: Pr. Moreau is Director of Interdisciplinary Canadian Collaborative Myalgic Encephalomyelitis (ICanCME) Research Network, a national research network funded by The Canadian Institutes of Health Research (Grant MNC—166142 to Pr. Moreau). Pr. Moreau, Dr. Fluge and Pr. Mella are members of the Scientific Advisory Board of the Open Medicine Foundation (USA). The authors declare no other competing interests.

Figures

Fig. 1
Fig. 1
Illustration of the experimental study design. ME encephalomyelitis, HC healthy controls, MFI-20 Multidimensional Fatigue Inventory, SF-36 36-Item Short-Form Health Survey, DSQ DePaul Symptom Questionnaire
Fig. 2
Fig. 2
Influence of covariates on plasma SMPDL3B levels and symptom severity in ME patients. (a) Plasma levels of SMPDL3B in ME patients (n = 249) and healthy controls (n = 63) from the Canadian cohort. (b) Plasma levels of SMPDL3B in different groups of patients with ME from the Norwegian cohort grouped by symptom severity (n = 16 for mild, n = 40 for mild/moderate, n = 41 for moderate, n = 22 moderate/severe and n = 21 severe). Disease severity was determined based on clinical assessments incorporating standardized and trial-specific questionnaires. (c) Plasma SMPDL3B levels in ME Canadian, ME Norwegian and healthy control female participants (n = 208, n = 119 and n = 33 respectively) and males (n = 41, n = 22 and n = 30 respectively). (d) Plasma concentrations of SMPDL3B in Canadian female ME participants across different age groups (n = 16 for 18–30 years, n = 97 for 31–50 for years, n = 95 for 51 years and up). (e) Plasma concentrations of SMPDL3B in Norwegian female ME participants across different age groups (n = 37 for 18–30 years, n = 65 31–50 for years, n = 16 for 51 years and up). (f) Plasma levels of SMPDL3B in Canadian female participants with or without oral contraceptive use (n = 176 and n = 32 respectively). (g) Plasma levels of SMPDL3B in Norwegian female participants with or without oral contraceptive use (n = 88 and n = 31 respectively). An unpaired T test was performed when comparing two groups. For comparisons between two groups, the Mann–Whitney U test was used. For comparisons involving more than two groups, the Kruskal–Wallis test was performed, followed by Dunn’s post hoc test with multiple comparison correction where appropriate. Differences were found to be significant at *P < 0.05, **P < 0.01, *** P-value < 0.001 and ****P < 0.0001
Fig. 3
Fig. 3
Reduced membrane-bound SMPDL3B caused by an increase of PLCXD1 expression and production in ME patients. a Number of SMPDL3B antigens per monocyte in ME patients (n = 27) and healthy controls (HC) (n = 9). Membrane-bound SMPDL3B levels were quantified using flow cytometry, with gating strategies applied to identify monocyte populations. b SMPDL3B antigens per monocyte in ME patients with low (n = 12) and high (n = 15) plasma SMPDL3B levels, with a 30 ng/ml threshold. c SMPDL3B antigens per monocyte in female (n = 22) and male (n = 5) ME patients. d SMPDL3B antigens per monocyte in female with (n = 5) and without (n = 22) contraceptive pill use. e Relative expression of SMPDL3B and PLCXD1 genes in ME patients (n = 51) and HC (n = 10). Gene expression was measured by RT-qPCR and normalized using GAPDH. f Relative expression of the SMPDL3B gene in females (n = 40) and males (n = 11) with ME. g Relative expression of IL-6 gene in PBMCs from 4 patients and 4 controls, treated for 4 h with increasing doses of LPS. h Difference in SMPDL3B levels between cell culture medium and cell lysate of PBMCs from ME patients (n = 4) and HC (n = 4) treated with increasing doses of LPS. i Illustration proposing a mechanism by which the reduction of membrane-bound SMPDL3B leads to an increase in PI-PLC through PKC activation upon stimulation of TLR4 by LPS. j Relative expression of PLCXD1 gene in PBMCs from 4 patients and 4 controls, treated for 4 h with increasing doses of LPS. k Correlation between the relative expression of PLCXD1 and SMPDL3B antigens per monocyte in ME patients (n = 20). Spearman correlation was used with an rho of -0.6253 and a p-value < 0.0032. T test was used when comparing two groups. For comparisons between two groups, the Mann–Whitney U test was used. For comparisons involving more than two groups, the Kruskal–Wallis test was performed, followed by Dunn’s post hoc test with multiple comparison correction where appropriate. Differences considered significant at *P < 0.05, **P < 0.01, ***P-value < 0.001 and ****P-value < 0.0001
Fig. 4
Fig. 4
Vildagliptin and Saxagliptin Modulate SMPDL3B Expression and Membrane Anchoring in PBMCs. The molecular structures of vildagliptin, saxagliptin and linagliptin are shown in panels a, b and c respectively. The data are displayed as a histogram with individual data points overlaid with mean and standard error of the mean (SEM). d Gene expression levels of SMPDL3B and PLCXD1 in PBMCs treated with increasing doses of vildagliptin. e Gene expression levels of SMPDL3B and PLCXD1 in PBMCs treated with increasing doses of saxagliptin. f Gene expression levels of SMPDL3B and PLCXD1 in PBMCs treated with increasing doses of linagliptin. Gene expression was measured using RT-qPCR with TaqMan probes and normalized to the housekeeping gene GAPDH. g Levels of membrane-bound SMPDL3B in monocytes after treatment with increasing doses of vildagliptin, saxagliptin and linagliptin (NT (no treatment), 25 µM, 50 µM, and 100 µM). Membrane-bound SMPDL3B levels were quantified using flow cytometry, with gating strategies applied to identify monocyte populations. h Levels of membrane-bound SMPDL3B in lymphocytes under the same conditions. Levels of soluble PI-PLC in cell culture supernatant of PBMCs following treatment with increasing doses of vildagliptin, saxagliptin and linagliptin. Soluble SMPDL3B and PI-PLC levels were quantified using ELISA. T test was used when comparing two groups. For comparisons between two groups, the Mann–Whitney U test was used. For comparisons involving more than two groups, the Kruskal–Wallis test was performed, followed by Dunn’s post hoc test with multiple comparison correction where appropriate. Differences were found to be significant at *P < 0.05, **P < 0.01, ***P-value < 0.001 and ****P-value < 0.0001
Fig. 5
Fig. 5
Vildagliptin and Saxagliptin Modulate SMPDL3B Expression and Membrane Anchoring in Patient PBMCs. Data are presented as bar graphs with individual data points overlaid, showing the mean ± standard error of the mean (SEM). a SMPDL3B and PLCXD1 gene expression levels in PBMCs from ME patients treated with 100 µM vildagliptin, saxagliptin, or linagliptin. b SMPDL3B gene expression in PBMCs stratified by plasma SMPDL3B levels (> 30 ng/mL or < 30 ng/mL) following treatment with 100 µM vildagliptin, saxagliptin, or linagliptin. c PLCXD1 gene expression in PBMCs stratified by plasma SMPDL3B levels following treatment with 100 µM vildagliptin, saxagliptin, or linagliptin. Gene expression was measured using RT-qPCR with TaqMan probes and normalized to GAPDH as a housekeeping gene. d Membrane-bound SMPDL3B levels in monocytes following treatment with 100 µM vildagliptin, saxagliptin, or linagliptin, assessed using flow cytometry. Gating strategies were applied to identify monocyte populations. e Membrane-bound SMPDL3B levels in monocytes stratified by plasma SMPDL3B levels (> 30 ng/mL or < 30 ng/mL) under the same treatment conditions. f Soluble SMPDL3B levels in the culture supernatant of patient PBMCs treated with 100 µM vildagliptin, saxagliptin, or linagliptin, quantified using ELISA. g Soluble SMPDL3B levels in the culture supernatant of PBMCs stratified by plasma SMPDL3B levels following treatment with 100 µM vildagliptin, saxagliptin, or linagliptin. h Soluble PI-PLC levels in the culture supernatant of PBMCs treated with 100 µM vildagliptin, saxagliptin, or linagliptin, quantified using ELISA. i Soluble PI-PLC levels in the culture supernatant of PBMCs stratified by plasma SMPDL3B levels following treatment with 100 µM vildagliptin, saxagliptin, or linagliptin. Statistical analysis was performed using an unpaired t-test for comparisons between two groups. For comparisons between two groups, the Mann–Whitney U test was used. For comparisons involving more than two groups, the Kruskal–Wallis test was performed, followed by Dunn’s post hoc test with multiple comparison correction where appropriate. Statistical significance was indicated as follows: P < 0.05 (*), P < 0.01 (**), P < 0.001 (***), and P < 0.0001 (****)

References

    1. Valdez AR, Hancock EE, Adebayo S, Kiernicki DJ, Proskauer D, Attewell JR, et al. Estimating prevalence, demographics, and costs of ME/CFS using large scale medical claims data and machine learning. Front Pediatr. 2018;6:412. - PMC - PubMed
    1. Canada OMF. Qu’est-ce que l’EM 2022. Available from: https://www.omfcanada.ngo/quest-ce-que-lem-sfc/?lang=fr.
    1. Yang T, Yang Y, Wang D, Li C, Qu Y, Guo J, et al. The clinical value of cytokines in chronic fatigue syndrome. J Transl Med. 2019;17(1):213. - PMC - PubMed
    1. Germain A, Ruppert D, Levine SM, Hanson MR. Metabolic profiling of a myalgic encephalomyelitis/chronic fatigue syndrome discovery cohort reveals disturbances in fatty acid and lipid metabolism. Mol Biosyst. 2017;13(2):371–9. - PMC - PubMed
    1. Naviaux RK, Naviaux JC, Li K, Bright AT, Alaynick WA, Wang L, et al. Metabolic features of chronic fatigue syndrome. Proc Natl Acad Sci USA. 2016;113(37):E5472–80. - PMC - PubMed

LinkOut - more resources