. 2025 Jul 7;26(1):195.
doi: 10.1186/s13059-025-03657-9.

A genome-wide association study integrated with single-cell and bulk profiles uncovers susceptibility genes for nasopharyngeal carcinoma involved in tumorigenesis via regulation of T cells

Affiliations

A genome-wide association study integrated with single-cell and bulk profiles uncovers susceptibility genes for nasopharyngeal carcinoma involved in tumorigenesis via regulation of T cells

Tong-Min Wang et al. Genome Biol. .

Abstract

Background: Nasopharyngeal carcinoma is an aggressive malignancy originating from the nasopharyngeal mucosa and associated with genetic factors. Many nasopharyngeal carcinoma susceptibility loci have been identified by genome-wide association studies (GWASs), but their underlying functional insights are largely unexplained.

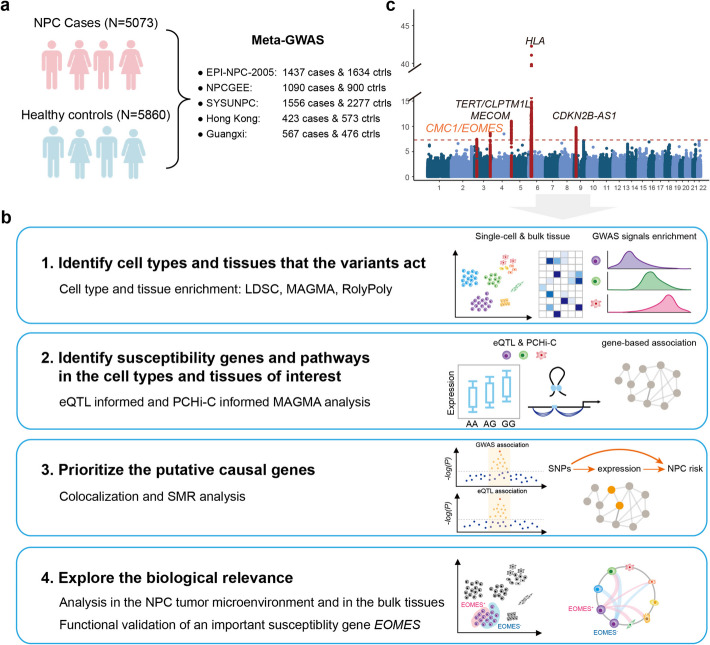
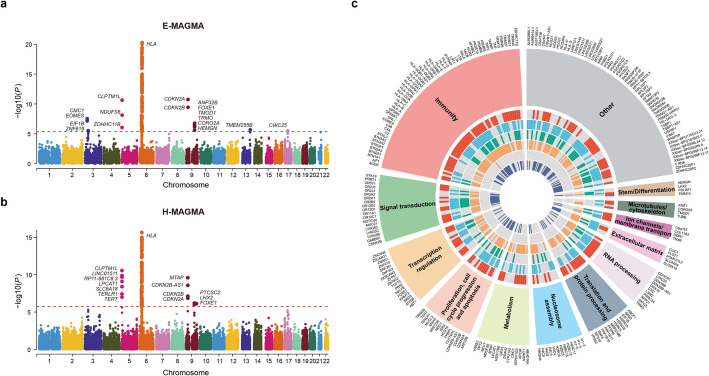
Results: A meta-GWAS including 5073 nasopharyngeal carcinoma patients and 5860 controls from nasopharyngeal carcinoma endemic areas identifies a total of 863 significant SNPs, including SNPs at a novel locus 3p24.1 (rs56365817; nearby genes: CMC1/EOMES). By integrating the GWAS signals with single-cell and bulk profiles, we find nasopharyngeal carcinoma susceptibility robustly associated with T cells in different methods and datasets. In nasopharyngeal carcinoma-associated cell type, we identify 234 putative susceptibility genes (81.62% of them novel), mainly enriched in immune-related biological processes. Five putative causal genes are prioritized. We perform in-depth bioinformatic analysis and functional experiments for EOMES, finding that the nasopharyngeal carcinoma-risk alleles of four functional SNPs upregulate EOMES expression by promoting the activity of regulatory elements in T cells, and EOMES participates in nasopharyngeal carcinoma tumorigenesis via regulation of CD8+ T cell exhaustion in the tumor microenvironment.

Conclusions: This study uncovers novel nasopharyngeal carcinoma susceptibility genes and their functional cell types, which improves the understanding of nasopharyngeal carcinoma genetic etiology.


Conflict of interest statement

Declarations. Ethics approval and consent to participate: Written informed consent was obtained from all patients. This study was approved by the Institutional Review Boards of Sun Yat-sen University Cancer Center. Competing interests: The authors declare no competing interests.

Figures

Fig. 1
Fig. 1
The workflow of the integrative study. a The study populations for the NPC meta-GWAS. b. The analysis workflow to interpret the genetic susceptibility. Firstly, the NPC-associated cell types and tissues were identified by cell type and tissue enrichment. Secondly, the susceptibility genes and pathways were identified through eQTL- and PCHi-C-informed MAGMA in the NPC-relevant cell types or tissues. The putative causal genes were prioritized by colocalization and summary-data-based Mendelian randomization (SMR) analysis, and the biological roles were explored. c The Manhattan plot of the NPC meta-GWAS results. The P values were calculated by fixed-effect meta-analysis in the five study populations. The dashed line represents a genome-wide significant threshold (P = 5 × 10–8), and the five significant loci are marked in red
Fig. 2
Fig. 2
Integrative analysis of GWAS and multi-omics data shows immune-related cell types are associated with NPC susceptibility. a The UMAP embedding plot showing 439,840 cells from 52 nasopharyngeal tumor tissues and 11 normal tissues sequenced by the 10 × Genomics platform. All the cells were assigned into six major cell types and 27 cell subtypes. b The UMAP embedding plot showing 1392 cells of five cell types from three primary and three lymph node metastasis nasopharyngeal tumor tissues sequenced by the Smart-seq2 platform. c The cell type enrichment results estimated by using LDSC, MAGMA, and RolyPoly with the HLA region included. The bars represent the -log10 transformed P values of the association. The dashed lines denote a significant threshold of P = 0.05. The significantly associated cell types in each method are labeled in red. The panels from top to bottom represent six major cell types and 27 cell subtypes in the 10 × Genomics data, and five cell types in the Smart-seq2 data. d The cell type enrichment results estimated by using LDSC, MAGMA, and RolyPoly with the HLA region excluded. e The heritability enrichment for NPC in the histone modifications regions of five markers (H3K36me3, H3K4me3, H3K4me1, H3K27ac, H3K9ac) and the open chromatin regions (DHS) across 9 categories of cell type or tissue from the ENTEX and RoadMap database. f The tissue type enrichment results estimated by using LDSC, MAGMA, and RolyPoly across 54 tissue types from GTEx v8 and the NPC tumor tissues. The bars show the most significant associations with the minimum P values among the three methods, where the P values are converted by -log10 transformation. The color indicates the numbers of method in which the tissue was significantly enriched
Fig. 3
Fig. 3
The integration of eQTL and PCHi-C data from the NPC-associated cell types and tissues identified susceptibility genes involved in multiple biological processes. a The Manhattan plot showing the results of eQTL-informed MAGMA (E-MAGMA) analysis in the NPC-associated cell types. The red dashed lines represent the significant thresholds for Bonferroni correction (P = 4.27 × 10−6). The significant genes are marked by larger dots. b The Manhattan plot showing the results of PCHi-C-informed MAGMA (H-MAGMA) analysis in the NPC-associated cell types. The red dashed lines represent the significant thresholds for Bonferroni correction (P = 1.79 × 10−6). The significant genes are marked by larger dots. c The circus plots showing information about the 234 NPC susceptibility genes. Genes are allocated into 13 biological processes, which were represented by different colors in the outmost circus heatmap. The six inner circles represent the cell types or tissues in which susceptibility genes were identified. The genes identified in blood and EBV-transformed LCL were colored in red; the genes identified in T and NK cells were colored in light blue; the genes identified in B cells were colored in green; the genes identified in myeloid cells were colored in orange; the genes identified in NPC tissues were colored in pink; the genes identified in immune-related tissues (thymus and spleen) were colored in dark blue
Fig. 4
Fig. 4
Colocalization and SMR analysis identifies five putative causal genes. a The five putative causal genes identified by COLOC (PPH4 > 0.8) and SMR (P < 2.72 × 10−4) with HEIDI test P value > 0.05. The top casual SNP represents the SNP with the highest posterior probability (PPH4) in COLOC analysis. The SNP ID, the effective allele, the other allele (EA/OA), the corresponding GWAS results (odds ratio, 95% confidence interval and GWAS P value), and the corresponding eQTL results (odds ratio, 95% confidence interval and eQTL P value) are shown. b Colocalization of the five putative causal genes between gene expression and NPC risk. The x-axis represents the -log10 transformed P value of GWAS, and the y-axis represents the -log10 transformed P value of eQTL for the corresponding gene. Different colors represent the linkage disequilibrium (r2) with the top causal SNP
Fig. 5
Fig. 5
NPC-risk alleles of the functional SNPs at 3p24.1 upregulate the expression of EOMES by promoting the activity of regulatory elements mainly in T cells. a The function annotations for the locus 3p24.1 in T cells. The four functional SNPs rs56188445, rs75831154, rs7633786, and rs60425255 (colored in orange) were identified by using DNase and histone ChIP-seq (H3K4me1, H3K4me3, and H3K27ac) data of T cells. The promoter-captured Hi-C (PCHi-C) loops in T cells that overlapped with four SNPs were colored in red. The PCHi-C loops links the four SNPs to EOMES promoter. These four candidate functional SNPs are in strong linkage disequilibrium (LD) with the GWAS lead SNP rs56365817 colored in red. b The association between the genotypes of a representative SNP rs56188445 and EOMES expression in different types of T cells from the ImmuNexUT database. c Luciferase activity of the DNA segments containing the functional SNP rs56188445 (left panel) and the functional SNPs rs75831154, rs7633786, and rs60425255 (right panel). The flanking sequences of the SNP(s) were cloned into the pGL3-basic luciferase reporter vector and transfected into Jurkat T cells. The four SNPs were mutated from the protective alleles to the risk alleles. The result of luciferase activity was normalized by pGL3-basic (N = 5). The data are presented as mean ± standard deviation (SD) and Student’s t test was used for statistical analysis. d The peaks of the enhancer marker H3K27ac from representative cells of different cell types from Roadmap or NPC cells. The peaks are shown as fold-change signals of the IP and the input samples of each cell type. The peak overlapped with the functional SNP rs56188445 was labeled as Region 1 and the peak overlapped with the other three functional SNPs was labeled as Region 2. e–g The DNA electropherogram of the PCR fragment generated using primers flanking the variant rs56188445 in Region 1 (e), flanking the variants rs75831154 and rs7633786 in Region 2 (f), and flanking the variant rs60425255 in Region 2 (g) following ChIP against H3K4me1, H3K4me3, and H3K27ac in Jurkat cells (upper left panels) and in C666-1 cells (upper right panels). The antibody against IgG was used as a negative control. The corresponding results of ChIP followed by quantitative PCR (ChIP-qPCR) are shown in the lower panels. The enrichment was quantified relative to the amount of input DNA (N = 3). The data are presented as mean ± standard deviation (SD) and Student’s t test was used for statistical analysis. * P < 0.05, ** P < 0.01, and *** P < 0.001
Fig. 6
Fig. 6
EOMES is mainly expressed in CD8T cells and is upregulated in the NPC microenvironment compared to the non-malignant nasopharynx microenvironment. a The UMAP embedding plot and the dot plot showing EOMES expression in the 10 × Genomics data. In the UMAP plot, the EOMES+ cells are labeled in yellow, the CD8T cells are labeled in dark blue, and the other cells are labeled in grey. The dot size represents the proportion of the cells with positive EOMES expression among the corresponding cell type, and the dot color represents the expression level. b The UMAP embedding plot and the dot plot showing EOMES expression in the Smart-seq2 data. c The boxplots showing the difference in the CD8+ T cell score between the samples with a higher and a lower EOMES expression level in the two NPC bulk datasets. The sample sizes of the two datasets (N = 89 and N = 113) are indicated. The P values are calculated by a two-sided Wilcoxon rank sum test. d The bar plot showing the proportion of EOMES+ cells among all cells in the tumor and the non-malignant microenvironment. Each dot represents a sample from the 10 × Genomics datasets. The P value is calculated by a two-sided Wilcoxon rank sum test. e The representative images of multiplex immunohistochemistry (mIHC) in one NPC tumor tissue samples (upper) and normal nasopharynx tissue samples (lower). The staining used anti-EOMES (orange), anti-CD8 (yellow), anti-Pan-CK (red), and anti-PD1 (green). Scale bars, 60 µm for each panel. f The percentage of EOMES+ cells in CD8+ cells and Pan-CK + cells in NPC tumor tissues (N = 43). g The percentage of EOMES+ cells among all cells in NPC tumor tissues (N = 43) and in normal nasopharynx tissues (N = 37). h The percentage of EOMES+CD8+ cells among all cells in NPC tumor tissues (N = 43) and in normal nasopharynx tissues (N = 37). f–h The bars represent mean ± standard deviation (SD) and Student’s t test was used for statistical analysis. * P < 0.05, ** P < 0.01, and *** P < 0.001
Fig. 7
Fig. 7
The different behaviors between EOMES+CD8+ and EOMESCD8+ T cells and the correlation of EOMES with CD8+ T cell exhaustion and NPC tumorigenesis. a The volcano plot showing the differentially expressed genes between the EOMES+CD8+ and EOMESCD8+ T cells. The significantly upregulated genes with an FDR-adjusted P value < 0.05 and a log2 transformed fold change > 0.15 are marked in red; the significantly downregulated genes with an FDR-adjusted P value < 0.05 and a log2 transformed fold change < − 0.15 are marked in green; the other genes are marked in grey. b The bar plots showing the top 20 GO terms and IPA canonical pathways with significant enrichment for the differentially expressed genes. c The cell–cell interaction strength of different cell types in NPC tumor (left panel) and non-malignant microenvironment (right panel). The x-axis represents the outgoing interaction strength and the y-axis represents the incoming interaction strength. The dot size denotes the number of predicted links (both incoming and outgoing) of each cell type. d The dot plot showing the ligand-receptor pairs significantly upregulated in the EOMES+CD8+ T cells than in the EOMESCD8+ T cells. The dot size represents the P value and the color represents the communication probability inferred by CellChat. e The violin plots showing the difference of T cell exhaustion score between the EOMES+CD8+ and EOMESCD8+ T cells in the 10 × Genomics datasets (left panel) and EOMEShigh and EOMESlow CD8+ T cells in the Smart-seq2 dataset (right panel). A two-sided Wilcoxon rank sum test was performed. f The dot plot representing the Spearman correlation between the expression level of EOMES and the five exhaustion markers in the 10 × Genomics (upper panel) and the Smart-seq2 (lower panel) datasets. The dot size represents the negative log-transformed P value and the color shows the coefficient of Spearman correlation. g The boxplots showing exhaustion scores among samples with a higher and a lower EOMES expression in the two bulk NPC datasets. A two-sided Wilcoxon rank sum test was used. h The percentage of EOMES+PD1+ cells among all cells from the multiplex immunohistochemistry (mIHC) in NPC tumor tissues (N = 43) and in normal nasopharynx tissues (N = 36). The bars represent mean ± standard deviation (SD) and Student’s t test was used for statistical analysis. * P < 0.05, ** P < 0.01 and *** P < 0.001

References

    1. Chen YP, Chan ATC, Le QT, Blanchard P, Sun Y, Ma J. Nasopharyngeal carcinoma. Lancet. 2019;394:64–80. - PubMed
    1. Young LS, Dawson CW. Epstein-Barr virus and nasopharyngeal carcinoma. Chin J Cancer. 2014;33:581–90. - PMC - PubMed
    1. Tsao SW, Tsang CM, Lo KW: Epstein-Barr virus infection and nasopharyngeal carcinoma. Philos Trans R Soc Lond B Biol Sci 2017, 372:20160270. - PMC - PubMed
    1. Tay JK, Zhu C, Shin JH, Zhu SX, Varma S, Foley JW, Vennam S, Yip YL, Goh CK, Wang Y, et al. The microdissected gene expression landscape of nasopharyngeal cancer reveals vulnerabilities in FGF and noncanonical NF-kappaB signaling. Sci Adv 2022, 8:eabh2445. - PMC - PubMed
    1. Bei JX, Zuo XY, Liu WS, Guo YM, Zeng YX. Genetic susceptibility to the endemic form of NPC. Chin Clin Oncol. 2016;5:15. - PubMed

MeSH terms