

Intestinal microbiota in adults with cholangiocarcinoma identifies the dysregulated Blautia species and bile acid metabolic pathways
- PMID: 40624612
- PMCID: PMC12235764
- DOI: 10.1186/s12876-025-04096-3
Intestinal microbiota in adults with cholangiocarcinoma identifies the dysregulated Blautia species and bile acid metabolic pathways
Abstract
Background: Cholangiocarcinoma (CCA) represents a significant global health concern. The gut and bile microbiota, which can influence the gut-liver axis and disease progression, have not been thoroughly characterized in CCA patients.
Methods: We selected two clinical centers at our hospital and collected stool samples from CCA patients and healthy controls (HC). These samples underwent whole-genome metagenomic shotgun sequencing, followed by analysis using both marker gene-based and assembly-based methods. Additionally, KEGG pathway enrichment was performed using the cholangiocarcinoma (CHOL) RNA-seq samples.
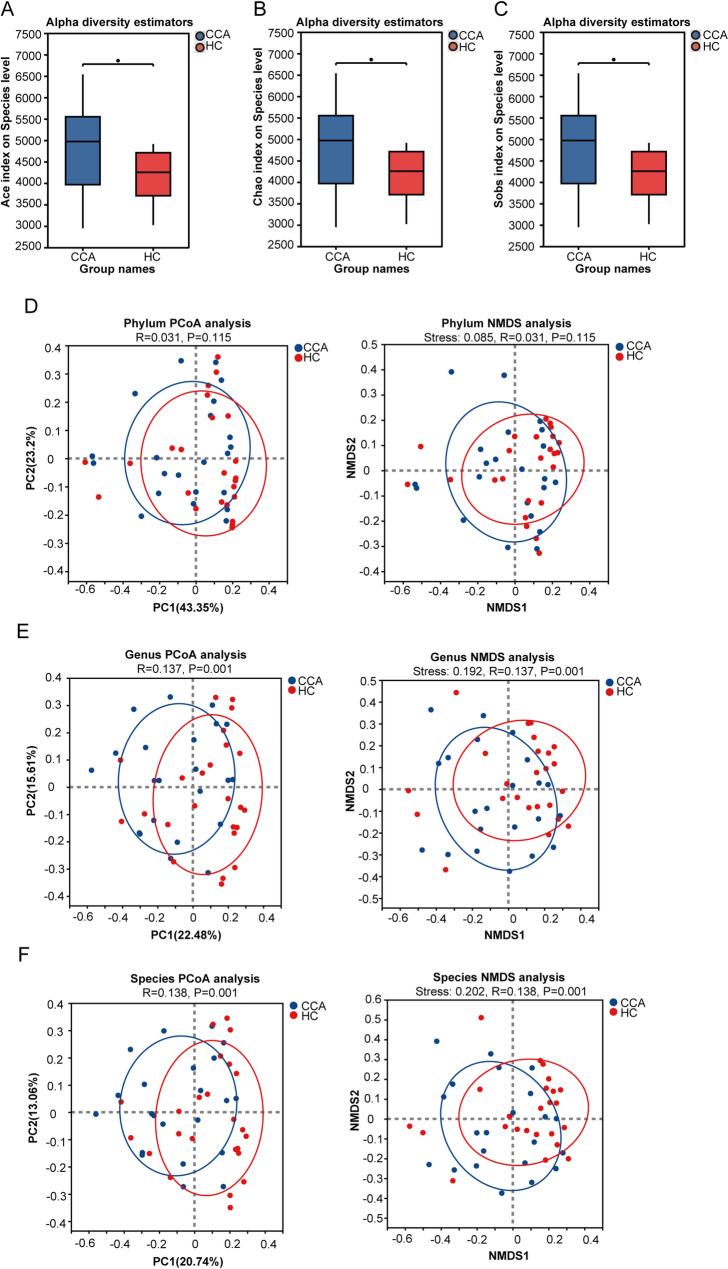
Results: Our results revealed distinct dysbiosis of the gut microbiota in our regional CCA patients. The results revealed greater heterogeneity in the gut microbiome of CCA patients compared to HC samples. We found Blautia species to be significantly less abundant in CCA samples, and can distinguish CCA patients from HC. Blautia can also play a role in influencing the modification of secondary bile acids. Additionally, down-regulation of arachidonic acid and linoleic acid metabolism was observed in the tumor tissues of CHOL patients. In summary, the results revealed significant heterogeneity difference in the gut microbiome of CCA patients compared to HC samples, and detected the specifically decreased Blautia species in CCA patients, suggesting that Blautia may influence bile acid metabolic pathways. Further investigation is warranted to explore Blautia as a potential biomarker for CCA.
Keywords: Blautia; Bacterial flora; Cholangiocarcinoma; Microbiomarkers.
© 2025. The Author(s).
Conflict of interest statement
Declarations. Ethics approval and consent to participate: This study was approved by the Medical Research Ethics Review Committee of Ningxia Medical University General Hospital (KYLL-2024-1316). All procedures of this study were performed following the principles outlined in the Declaration of Helsinki. Consent for publication: Not applicable. Competing interests: The authors declare no competing interests.
Figures


Similar articles
-
Gut Microbiome and Bile Acid Interactions: Mechanistic Implications for Cholangiocarcinoma Development, Immune Resistance, and Therapy.Am J Pathol. 2025 Mar;195(3):397-408. doi: 10.1016/j.ajpath.2024.11.004. Epub 2024 Dec 19. Am J Pathol. 2025. PMID: 39730075 Review.
-
Multi-omics study reveals gut microbiota dysbiosis and tryptophan metabolism alterations in GH-PitNET progression.Sci Rep. 2025 Jul 7;15(1):24261. doi: 10.1038/s41598-025-07812-x. Sci Rep. 2025. PMID: 40624207 Free PMC article.
-
Effects of a veterinary gastrointestinal diet on fecal characteristics, metabolites, and microbiota concentrations of adult cats treated with metronidazole.J Anim Sci. 2024 Jan 3;102:skae274. doi: 10.1093/jas/skae274. J Anim Sci. 2024. PMID: 39279199
-
[1]The human gut microbiota in IBD, characterizing hubs, the core microbiota and terminal nodes: a network-based approach.BMC Microbiol. 2025 Jun 26;25(1):371. doi: 10.1186/s12866-025-04106-0. BMC Microbiol. 2025. PMID: 40571931 Free PMC article.
-
Systemic pharmacological treatments for chronic plaque psoriasis: a network meta-analysis.Cochrane Database Syst Rev. 2021 Apr 19;4(4):CD011535. doi: 10.1002/14651858.CD011535.pub4. Cochrane Database Syst Rev. 2021. Update in: Cochrane Database Syst Rev. 2022 May 23;5:CD011535. doi: 10.1002/14651858.CD011535.pub5. PMID: 33871055 Free PMC article. Updated.
References
-
- Park EM, Chelvanambi M, Bhutiani N, Kroemer G, Zitvogel L, Wargo JA. Targeting the gut and tumor microbiota in cancer. Nat Med. 2022;28(4):690–703. - PubMed
-
- Pabst O, Hornef MW, Schaap FG, Cerovic V, Clavel T, Bruns T. Gut-liver axis: barriers and functional circuits. Nat Reviews Gastroenterol Hepatol. 2023;20(7):447–61. - PubMed
MeSH terms
Substances
Grants and funding
- XZ2024033/Ningxia Medical University Institutional Scientific Research Fund
- XZ2024033/Ningxia Medical University Institutional Scientific Research Fund
- XZ2024033/Ningxia Medical University Institutional Scientific Research Fund
- XZ2024033/Ningxia Medical University Institutional Scientific Research Fund
- XZ2024033/Ningxia Medical University Institutional Scientific Research Fund
- XZ2024033/Ningxia Medical University Institutional Scientific Research Fund
- XZ2024033/Ningxia Medical University Institutional Scientific Research Fund
- XZ2024033/Ningxia Medical University Institutional Scientific Research Fund
- XZ2024033/Ningxia Medical University Institutional Scientific Research Fund
- 2022BSB03112/the Ningxia Gut Homeostasis and Chronic Disease Prevention and Treatment Scientific and Technological Innovation Team, China
- 2022BSB03112/the Ningxia Gut Homeostasis and Chronic Disease Prevention and Treatment Scientific and Technological Innovation Team, China
- 2022BSB03112/the Ningxia Gut Homeostasis and Chronic Disease Prevention and Treatment Scientific and Technological Innovation Team, China
- 2022BSB03112/the Ningxia Gut Homeostasis and Chronic Disease Prevention and Treatment Scientific and Technological Innovation Team, China
- 2022BSB03112/the Ningxia Gut Homeostasis and Chronic Disease Prevention and Treatment Scientific and Technological Innovation Team, China
- 2022BSB03112/the Ningxia Gut Homeostasis and Chronic Disease Prevention and Treatment Scientific and Technological Innovation Team, China
- 2022BSB03112/the Ningxia Gut Homeostasis and Chronic Disease Prevention and Treatment Scientific and Technological Innovation Team, China
- 2022BSB03112/the Ningxia Gut Homeostasis and Chronic Disease Prevention and Treatment Scientific and Technological Innovation Team, China
- 2022BSB03112/the Ningxia Gut Homeostasis and Chronic Disease Prevention and Treatment Scientific and Technological Innovation Team, China
- 2023GKLRLX17/Program of Ningxia Science and Technology Leading Talent, China
- 2023GKLRLX17/Program of Ningxia Science and Technology Leading Talent, China
- 2023GKLRLX17/Program of Ningxia Science and Technology Leading Talent, China
- 2023GKLRLX17/Program of Ningxia Science and Technology Leading Talent, China
- 2023GKLRLX17/Program of Ningxia Science and Technology Leading Talent, China
- 2023GKLRLX17/Program of Ningxia Science and Technology Leading Talent, China
- 2023GKLRLX17/Program of Ningxia Science and Technology Leading Talent, China
- 2023GKLRLX17/Program of Ningxia Science and Technology Leading Talent, China
- 2023GKLRLX17/Program of Ningxia Science and Technology Leading Talent, China
LinkOut - more resources
Full Text Sources
Medical
