

Comparison of Random Survival Forest Based-Overall Survival With Deep Learning and Cox Proportional Hazard Models in HER-2-Positive HR-Negative Breast Cancer
- PMID: 40624807
- PMCID: PMC12234386
- DOI: 10.1002/cnr2.70262
Comparison of Random Survival Forest Based-Overall Survival With Deep Learning and Cox Proportional Hazard Models in HER-2-Positive HR-Negative Breast Cancer
Abstract
Background: Traditional CoxPH models are limited in handling real-world data complexities. While machine learning models like RSF and DeepSurv show promise, their application and comparative evaluation in the HER2-positive/HR-negative breast cancer subtype require further validation.
Aims: This study aims to build a survival prediction model for breast cancer patients based on different methods. The optimal model will provide more accurate survival predictions for clinical decision-making of HER2 positive and HR negative cancer patients.
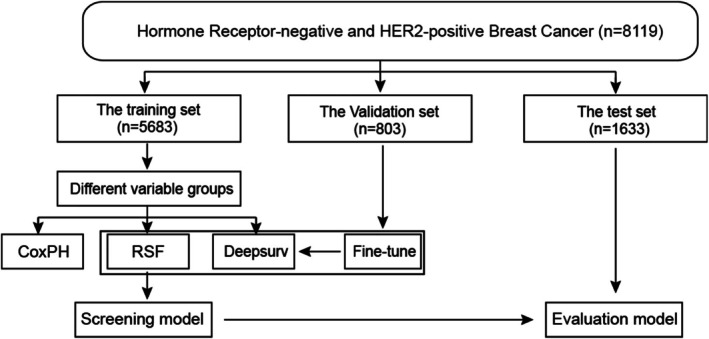
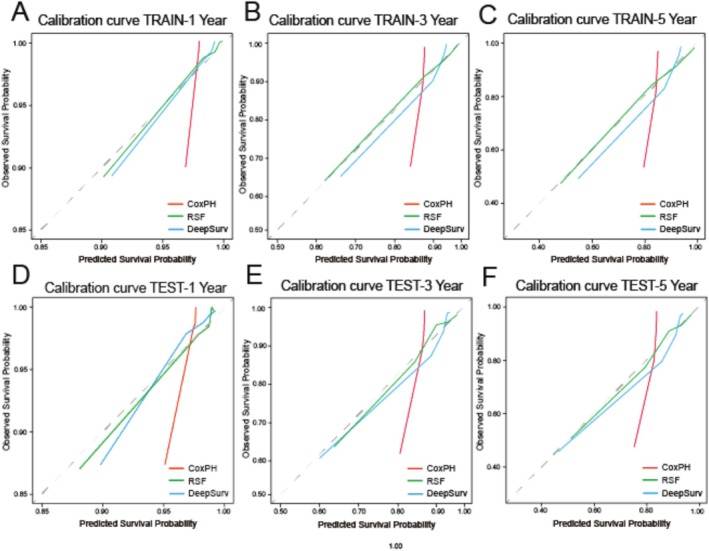
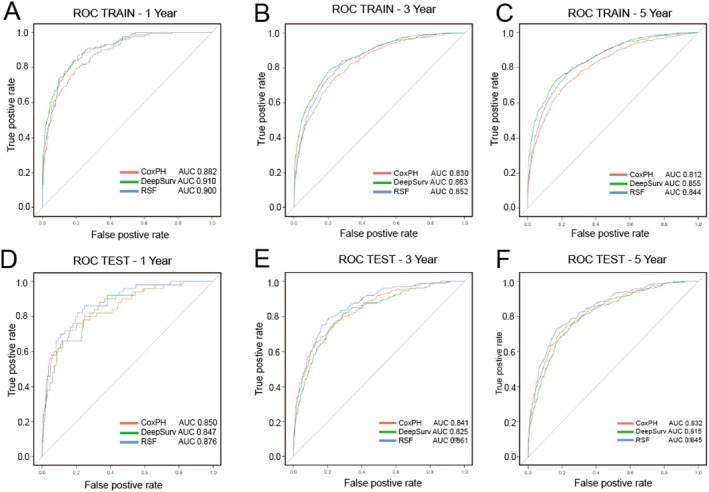
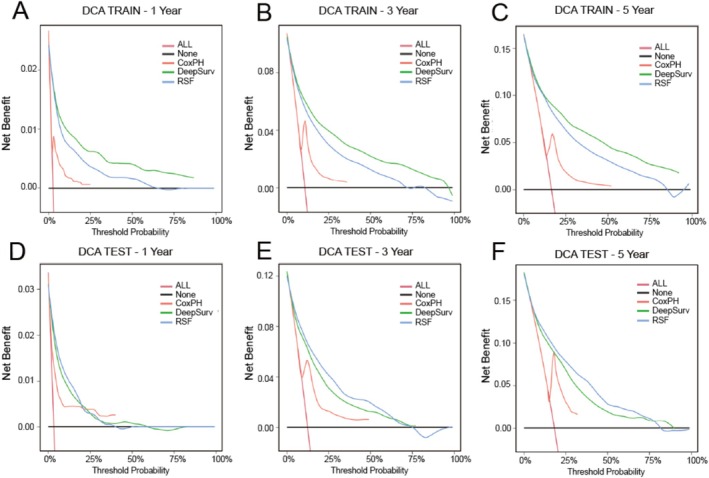
Methods and results: This study analyzed 8,119 HER2-positive HR-negative breast cancer patients from the SEER database, randomly allocated to training/validation/test cohorts (7:1:2 ratio). Predictive models were developed using five feature sets and three algorithms (Cox PH, RSF, DeepSurv), with feature selection optimized via Concordance index (C-index). Evaluation revealed: The C-index of the DeepSurv models constructed using the training set is greater than 0.8, performing better than both the RSF and CoxPH models. However, CoxPH outperforms DeepSurv in terms of C-index when testset. The Brier scores for all models were below 0.25. Which indicates that the models predicted with high accuracy. Based on the training set, the Deepsurv model predicted the highest ROC-AUCs of 0.91, 0.863, and 0.855 for 1-, 3-, and 5-year overall survival (OS), respectively. The RSF model achieved the highest AUCs, specifically 0.876, 0.861, and 0.845, for 1-, 3-, and 5-year overall survival in the test group. The calibration graphs indicate that of the three models forecasting overall survival at 1, 3, and 5 years, the RSF model demonstrated the greatest level of agreement between predictions and actual observations, trailed by the DeepSurv model. There was poor agreement between CoxPH model predictions and observed data. Optimal Clinical Net Benefits at 1, 3, and 5 Years for DCA of the Deepsurv Model in the Training Set Data. However, in the test set, compared to other models, RSF showed better Optimal Clinical Net Benefits.
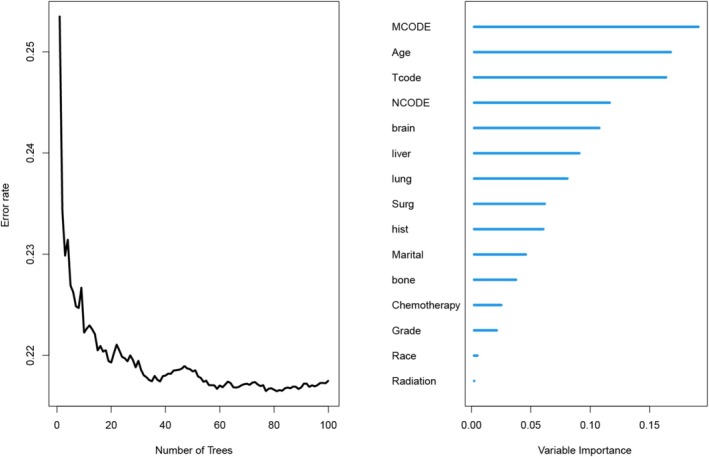
Conclusions: In conclusion, compared to conventional prognostic models, the Random Survival Forest (RSF) model serves as a reliable tool for predicting long-term survival in breast cancer patients, demonstrating consistent performance across diverse datasets. Furthermore, the feature set selected via RSF-Variable Importance (VIMP) (compared with LASSO regression and Cox regression) significantly enhances the performance of prognostic models. Our findings may offer practical guidance for future development of long-term prognostic models tailored to breast cancer subtypes.
Keywords: CoxPH; Deepsurv; RSF; RSF‐VIMP; breast cancer.
© 2025 The Author(s). Cancer Reports published by Wiley Periodicals LLC.
Conflict of interest statement
The authors declare no conflicts of interest.
Figures
Similar articles
-
Deep learning model for predicting the survival of patients with primary gastrointestinal lymphoma based on the SEER database and a multicentre external validation cohort.J Cancer Res Clin Oncol. 2023 Oct;149(13):12177-12189. doi: 10.1007/s00432-023-05123-0. Epub 2023 Jul 10. J Cancer Res Clin Oncol. 2023. PMID: 37428248 Free PMC article.
-
Comparison of Two Modern Survival Prediction Tools, SORG-MLA and METSSS, in Patients With Symptomatic Long-bone Metastases Who Underwent Local Treatment With Surgery Followed by Radiotherapy and With Radiotherapy Alone.Clin Orthop Relat Res. 2024 Dec 1;482(12):2193-2208. doi: 10.1097/CORR.0000000000003185. Epub 2024 Jul 23. Clin Orthop Relat Res. 2024. PMID: 39051924
-
Development and validation of a Log odds of negative lymph nodes/T stage ratio-based prognostic model for gastric cancer.Front Oncol. 2025 Jun 3;15:1554270. doi: 10.3389/fonc.2025.1554270. eCollection 2025. Front Oncol. 2025. PMID: 40530015 Free PMC article.
-
Cost-effectiveness of using prognostic information to select women with breast cancer for adjuvant systemic therapy.Health Technol Assess. 2006 Sep;10(34):iii-iv, ix-xi, 1-204. doi: 10.3310/hta10340. Health Technol Assess. 2006. PMID: 16959170
-
Impact of residual disease as a prognostic factor for survival in women with advanced epithelial ovarian cancer after primary surgery.Cochrane Database Syst Rev. 2022 Sep 26;9(9):CD015048. doi: 10.1002/14651858.CD015048.pub2. Cochrane Database Syst Rev. 2022. PMID: 36161421 Free PMC article.
References
-
- Berg J. W. and Hutter R. V., “Breast Cancer,” Cancer 75, no. 1 Suppl (1995): 257–269. - PubMed
-
- Slamon D. J., Clark G. M., Wong S. G., Levin W. J., Ullrich A., and McGuire W. L., “Human Breast Cancer: Correlation of Relapse and Survival With Amplification of the HER‐2/Neu Oncogene,” Science 235, no. 4785 (1987): 177–182. - PubMed
-
- Untch M., Gelber R. D., Jackisch C., et al., “Estimating the Magnitude of Trastuzumab Effects Within Patient Subgroups in the HERA Trial,” Annals of Oncology 19, no. 6 (2008): 1090–1096. - PubMed
-
- Waks A. G. and Winer E. P., “Breast Cancer Treatment: A Review,” JAMA 321, no. 3 (2019): 288–300. - PubMed
-
- Debien V., de Azambuja E., and Piccart‐Gebhart M., “Optimizing Treatment for HER2‐Positive HR‐Positive Breast Cancer,” Cancer Treatment Reviews 115 (2023): 102529. - PubMed
Publication types
MeSH terms
Substances
Grants and funding
- 82073349/National Natural Science Foundation of China
- 2024AFD426/Natural Science Foundation of Hubei Province
- 2024AFB799/Natural Science Foundation of Hubei Province
- 2018CFB561/Natural Science Foundation of Hubei Province
- ZNPY2016043/Zhongnan Hospital of Wuhan University Science, Technology and Innovation Seed Fund
LinkOut - more resources
Full Text Sources
Medical
Research Materials
Miscellaneous
