. 2025 Jun 20:16:1603338.
doi: 10.3389/fimmu.2025.1603338. eCollection 2025.

A set of plasmatic microRNA related to innate immune response highly predicts the onset of immune reconstitution inflammatory syndrome in tuberculosis co-infected HIV individuals (ANRS-12358 study)

Affiliations

A set of plasmatic microRNA related to innate immune response highly predicts the onset of immune reconstitution inflammatory syndrome in tuberculosis co-infected HIV individuals (ANRS-12358 study)

Polidy Pean et al. Front Immunol. .

Abstract

Background: After initiation of combination antiretroviral treatment (cART), HIV-1/tuberculosis coinfected patients are at high risk of developing tuberculosis-associated immune reconstitution inflammatory syndrome (TB-IRIS). MicroRNAs, small molecules of approximately 22 nucleotides, which regulate post-transcriptional gene expression and their profile has been proposed as a biomarker for many diseases. We tested whether the microRNA profile could be a predictive biomarker for TB-IRIS.

Methods: Twenty-six selected microRNAs involved in the regulation of the innate immune response were investigated. Free plasmatic and microRNA-derived exosomes were measured by flow cytometry. The plasma from 74 HIV-1+TB+ individuals (35 IRIS and 39 non-IRIS) at the time of the diagnosis and before any treatment (baseline) of CAMELIA trial (ANRS1295-CIPRA KH001-DAIDS-ES ID10425); 15 HIV+TB- and 23 HIV-TB+, both naïve of any treatment; and 20 HIV-TB- individuals as controls were analysed.

Results: At baseline, both IRIS and non-IRIS HIV+/TB+ individuals had similar demographic and clinical characteristics, including sex, age, body mass index, very low CD4+ cell counts (27 cells/mm3), and plasma HIV RNA load levels (5.76 log copies/ml). Twenty out of 26 plasmatic-microRNAs tested were no different between IRIS and controls. Twelve of the 26 tested microRNAs showed statistically significant differences between IRIS and non-IRIS patients (p-values ranging from p <0.05 to p <0.0001). Among these, five could discriminate between IRIS and non-IRIS individuals using ROC curve analysis (AUC scores ranging from 0.74 to 0.92). The combination of two (hsa-mir-29c-3p and hsa-mir-146a-5p) or three microRNAs (hsa-mir-29c-3p, hsa-mir-29a-3p, and hsa-mir-146a-5p) identified IRIS with 100% sensitivity and high specificity (95% and 97%, respectively).

Conclusion: The combination of at least two or three plasmatic microRNAs known to regulate inflammation and/or cytokine responses could be used as biomarkers to discriminate IRIS from non-IRIS in HIV-TB co-infected individuals at the time of diagnosis and prior to any treatment.

Keywords: HIV; IRIS; biomarkers; exosomes; microRNA; tuberculosis.


Conflict of interest statement

The authors declare that the research was conducted in the absence of any commercial or financial relationships that could be construed as a potential conflict of interest. The author(s) declared that they were an editorial board member of Frontiers, at the time of submission. This had no impact on the peer review process and the final decision.

Figures

Figure 1
Figure 1
Differential expression of twelve plasma microRNAs in IRIS and non-IRIS patients at baseline and controls. The expression level of the tested plasma microRNAs is indicated on the Y-axis. The X-axis represents the study groups. Lower plasma levels were found in IRIS individuals compared to non-IRIS individuals. Non-IRIS individuals have higher plasma levels for the twelve microRNAs : (A) hsa-mir-29a-3p; (B) hsa-mir-29b-3p; (C) hsa-mir-29c-3p; (D) hsa-mir-33a-5p; (E) has-mir-146a-5p; (F) hsa-mir-223-3p; (G) hsa-mir-16-1-3p; (H) hsa-mir-25-3p; (I) hsa-mir-532-5p; (J) has-mir-590-5p; (K) hsa-mir-30e-5p; and (L) has-mir-148a-3p. In contrast, IRIS patients have similar levels compared to TB and HIV controls. Kruskal-Wallis test was used for analysis. Results are presented as median (25%-75% IQR) log10MFI. Statistically significant difference is indicated: * p<0.05; ** p=0.01; *** p=0.001; and **** p<0.0001.
Figure 2
Figure 2
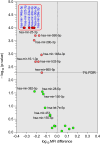
Volcano plot of the differential expression of the tested plasma microRNAs between IRIS and non-IRIS patients at baseline. The circular dots represent the differences in the median value of each plasma microRNA level and its p-value in transformed -log10 between the IRIS and non-IRIS groups. The name of each microRNA is shown on the graph. The x-axis shows the log10 MFI difference in plasma microRNA levels between the IRIS and non-IRIS groups, while the y-axis shows the distribution of p-values (transformed to -log10) obtained from the statistical comparison between the IRIS and non-IRIS groups for each plasma microRNA. A control false discovery rate (FDR) of 1%, represented by a horizontal dotted line, was established to determine the small p-values of the corresponding comparison using the Benjamini method for stacked p-value analysis (GraphPad Prism v10). Significantly different levels are represented by red dots. Among these, six plasma microRNAs with p-values less than 0.0001, shown in the square box, were selected for further analysis.
Figure 3
Figure 3
Plasma levels of microRNAs at IRIS onset and fold change from baseline to IRIS onset in IRIS versus non-IRIS patients. (A) Plasma levels of six of the 26 microRNAs tested are shown. These microRNAs were significantly different between IRIS and non-IRIS subjects. (B) The fold change of ten microRNAs that were significantly different between IRIS and non-IRIS individuals are shown. The Wilcoxon matched-pair test was used for analysis and results are presented as median (25%-75% IQR). Statistically significant differences between study groups are indicated as follows: *p<0.05; **p=0.01; ***p=0.001.
Figure 4
Figure 4
Receiver Operating characteristic (ROC) curve analysis of five microRNAs in IRIS versus non-IRIS patients at baseline. (A) Five plasma microRNAs that were highly significantly different between IRIS (n=35) and non-IRIS (n=39) were selected for ROC curve analysis using GraphPad Prism software version 10. The results of area under the curve (AUC), p-value, sensitivity (SE), specificity (SP) and cut-off (in log10MFI) for each microRNA marker are shown. The arrow on the curve indicates the point of a specific threshold with corresponding sensitivity and specificity. (B) The combinatorial ROC curve analysis of the five microRNAs was performed using the web-based application CombiROC (http://combiroc.eu/). Both combinatorial ROC curves have a sensitivity of 100% and a specificity of more than 94%. The proportions of false positive (FP), false negative (FN), true positive (TP) and true negative (TN) are shown in the pie chart.

References

    1. Diener C, Keller A, Meese E. The miRNA-target interactions: An underestimated intricacy. Nucleic Acids Res. (2024) 52:1544–57. doi: 10.1093/nar/gkad1142 - DOI - PMC - PubMed
    1. Wang J, Chen J, Sen S. MicroRNA as biomarkers and diagnostics. J Cell Physiol. (2016) 231:25–30. doi: 10.1002/jcp.v231.1 - DOI - PMC - PubMed
    1. Tribolet L, Kerr E, Cowled C, Bean AGD, Stewart CR, Dearnley M, et al. MicroRNA biomarkers for infectious diseases: from basic research to biosensing. Front Microbiol. (2020) 11:1197. doi: 10.3389/fmicb.2020.01197 - DOI - PMC - PubMed
    1. Almeida MI, Reis RM, Calin GA. MicroRNA history: discovery, recent applications, and next frontiers. Mutat Res. (2011) 717:1–8. doi: 10.1016/j.mrfmmm.2011.03.009 - DOI - PubMed
    1. Stein LD, Bao Z, Blasiar D, Blumenthal T, Brent MR, Chen N, et al. The genome sequence of Caenorhabditis briggsae: a platform for comparative genomics. PloS Biol. (2003) 1:E45. doi: 10.1371/journal.pbio.0000045 - DOI - PMC - PubMed

MeSH terms