Mining candidate genes for maize plant height based on a GWAS, Meta-QTL, and WGCNA
- PMID: 40625872
- PMCID: PMC12230025
- DOI: 10.3389/fpls.2025.1587217
Mining candidate genes for maize plant height based on a GWAS, Meta-QTL, and WGCNA
Abstract
Introduction: In maize, plant height (PH) is one of the most important agronomic traits that directly influences planting density and yield. Therefore, identifying candidate genes related to PH will help manipulate maize yield indirectly.
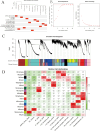
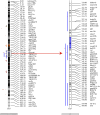
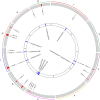
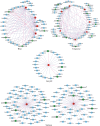
Methods: The present research carried out a genome-wide association study (GWAS) of PH using a natural population of 580 maize inbred lines. Further, after collecting the published transcriptome data of maize B73, tissue-specific gene co-expression modules related to PH were generated using weighted gene co-expression network analysis (WGCNA). Furthermore, a meta-analysis of the already reported PH-related quantitative trait loci (QTLs).
Results: The integrated analysis of the results based on the different approaches screened three candidate genes: Zm00001d031796, encoding AP2-EREBP transcription factor 172; Zm00001d009918, encoding Phytochrome A-associated F-box protein; and Zm00001d042454, encoding plastid specific ribosomal protein 4.
Keywords: GWAS; Meta-QTL; WGCNA; candidate gene; maize; plant height.
Copyright © 2025 Qian, Zhang, Chen, Sang and Li.
Conflict of interest statement
The authors declare that the research was conducted in the absence of any commercial or financial relationships that could be construed as a potential conflict of interest.
Figures


Similar articles
-
Identification and development of KASP markers for genetic loci controlling plant height in bread wheat and evaluation their effects using near isogenic lines.BMC Plant Biol. 2025 Jul 2;25(1):832. doi: 10.1186/s12870-025-06820-3. BMC Plant Biol. 2025. PMID: 40604427 Free PMC article.
-
Identification of new candidate genes affecting drip loss in pigs based on genomics and transcriptomics data.J Anim Sci. 2025 Jan 4;103:skaf177. doi: 10.1093/jas/skaf177. J Anim Sci. 2025. PMID: 40485044 Free PMC article.
-
Heritability estimates and genome-wide association study of methane emission traits in Nellore cattle.J Anim Sci. 2024 Jan 3;102:skae182. doi: 10.1093/jas/skae182. J Anim Sci. 2024. PMID: 38967061 Free PMC article.
-
A meta-analysis of genome-wide association studies to identify candidate genes associated with feed efficiency traits in pigs.J Anim Sci. 2025 Jan 4;103:skaf010. doi: 10.1093/jas/skaf010. J Anim Sci. 2025. PMID: 39847436 Free PMC article.
-
Assessing the comparative effects of interventions in COPD: a tutorial on network meta-analysis for clinicians.Respir Res. 2024 Dec 21;25(1):438. doi: 10.1186/s12931-024-03056-x. Respir Res. 2024. PMID: 39709425 Free PMC article. Review.
References
LinkOut - more resources
Full Text Sources
Research Materials

