. 2025 Jun 20:12:1616073.
doi: 10.3389/fmolb.2025.1616073. eCollection 2025.

Developing a molecular diagnostic model for heatstroke-induced coagulopathy: a proteomics and metabolomics approach

Affiliations

Developing a molecular diagnostic model for heatstroke-induced coagulopathy: a proteomics and metabolomics approach

Qingbo Zeng et al. Front Mol Biosci. .

Abstract

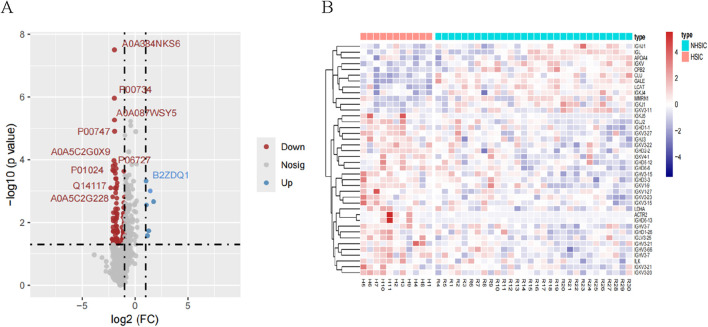
Background: Heatstroke (HS) is becoming more concerning, with coagulopathy contributing to higher mortality. The aim of this study was to analyze the metabolomic and proteomic profiles associated with heatstroke-induced coagulopathy (HSIC) and to develop a molecular diagnostic model based on proteomic and metabolomic patterns.

Methods: This study included 41 HS patients from the Department of Critical Care Medicine at a comprehensive teaching hospital. Plasma proteins and metabolites from HSIC and non-heatstroke-induced coagulopathy (NHSIC) patients were compared using LC-MS/MS. Multivariate and univariate statistical analyses identified differentially expressed proteins (DEPs) and metabolites (DEMs). Functional annotation and pathway enrichment analyses were performed using the GO and KEGG databases, and machine learning models were developed using candidate proteins selected by LASSO and Boruta algorithms to diagnose HSIC. Finally, bioinformatic analysis was used to integrate the results of proteomics and metabolomics to find the potential mechanisms of HSIC.

Results: A total of 41 patients participated in the study, with 11 cases in the HSIC group and 30 cases in the NHSIC group. Significant differences were observed between the groups in temperature, heart rate, white blood cell count, platelet count, liver function, coagulation markers, APACHE II score, and GCS score. Survival analysis revealed that the heatstroke group had a higher mortality risk. A total of 125 DEPs and 110 DEMs were identified, primarily enriched in energy regulation-related pathways and lipid and carbohydrate metabolism. Additionally, three optimal predictive models (AUC >0.9) were developed and validated for classifying HSIC from HS individuals based on proteomic patterns and machine learning, with the logistic regression model showing the best diagnostic performance (AUC = 0.979, sensitivity = 81.8%, specificity = 96.7%), highlighting lactate dehydrogenase A chain (LDHA), neutrophil gelatinase-associated lipocalin (NGAL), prothrombin and glucan-branching enzyme (GBE) as key predictors of HSIC.

Conclusion: The study uncovered critical metabolic and protein changes linked to heatstroke, highlighting the involvement of energy regulation, lipid metabolism, and carbohydrate metabolism. Building on these findings, an optimal machine learning diagnostic model was developed to boost the accuracy of HSIC diagnosis, integrating LDHA, NGAL, prothrombin, and GBE as key biomarkers.

Keywords: coagulopathy; heatstroke; machine learning; metabolomics; proteomics.


Conflict of interest statement

The authors declare that the research was conducted in the absence of any commercial or financial relationships that could be construed as a potential conflict of interest.

Figures

FIGURE 1
FIGURE 1
The flowchart.
FIGURE 2
FIGURE 2
(A) A scatterplot of APACHE II score comparison in the NHSIC vs. HSIC group; (B) Kaplan–Meier curves for adverse outcome according to the study groups.
FIGURE 3
FIGURE 3
(A) A total of 125 differentially expressed proteins were screened in the NHSIC vs. HSIC group (6 upregulated and 119 downregulated). (B) Cluster analysis of DEPs in the group of NHSIC vs. HSIC.
FIGURE 4
FIGURE 4
Functional enrichment analysis of NHSIC vs. HSIC differentially expressed protein. (A) The enriched GO functional classification, which is divided into three major categories: Biological Process (BP), Molecular Function (MF), and Cellular Component (CC). The color of the bar graph indicates the significance of the enriched GO functional classification, which is based on Fisher’s accuracy; Fisher’s Exact Test calculated the P value. The color gradient represents the size of the P value, from red to blue; the closer to blue, the smaller the P value, and the higher the significance level of the enrichment of the corresponding GO function category. (B) The DEPs mainly concentrated in complement and coagulation cascades, cholesterol metabolism, and neuroactive ligand−receptor interaction. (C) DEP interaction networks in group of NHSIC vs. HSIC.
FIGURE 5
FIGURE 5
Diagnostic indicators for HSIC screening. (A) Fine-tuning the least absolute shrinkage and selection operator (LASSO) model’s feature selection. The ordinate represents the value of the coefficient, the lower abscissa represents log (l), and the upper abscissa represents the current number of non-zero coefficients in the model. (B) LASSO coefficient profiles. (C) The important indicators in Lasso. (D) History of decisions of rejecting or accepting features by Random Forest in 100 Boruta function runs. (E) Boxplot of all features from random forest analysis, with green indicating important variables, while red, blue, and yellow represent rejected variables. (F) Venn diagram showing overlapping markers. (G) Principal component analysis shows that the four proteins aforementioned can clearly distinguished NHSIC and HSIC. (H) The correlation among LDHA, Prothrombin, NGAL, GBE.
FIGURE 6
FIGURE 6
(A) The AUC of the three models. (B) Learning curve. (C) Calibration curves for the LR model for predicting HSIC probability. (D) Decision curve analysis evaluating the clinical benefit of the predictive model. (E) Feature importance derived from LR model. (F) Confusion matrix showing the classification accuracy. (G) Explaining of patient prediction results. (H) User-friendly interface of the LR model facilitating HSIC probability prediction.
FIGURE 7
FIGURE 7
Relationship between (A) LDHA, (B) NGAL, (C) Prothrombin, (D) GBE and predicted HSIC.
FIGURE 8
FIGURE 8
(A) Score chart of PCA analysis. (B) Score chart of OPLS-DA analysis. (C) PLS-DA model validation diagram. (D) A volcano plot of the differential metabolites. (E) A bubble diagram of top-25 metabolic pathways.
FIGURE 9
FIGURE 9
(A) The proteomics (left) and metabolomics (right) features can clearly distinguish the samples. (B) The multi-omics correlation plot shows the Pearson correlation between proteomics and metabolomics, supporting their integration and the presentation of a joint signature. (C) Correlation analysis of the differential proteins and metabolites. (D) The multi-omics clustering heatmap is structured such that samples are displayed in rows and molecular features (e.g., proteins, metabolites) are arranged in columns. (E) KEGG pathway annotation of differential proteins and metabolites.

References

    1. Author Anonymous (2021). Update: Heat illness, active component, U.S. Armed Forces, 2020. MSMR 28 (4), 10–15. - PubMed
    1. Bouchama A., Abuyassin B., Lehe C., Laitano O., Jay O., O’Connor F. G., et al. (2022). Classic and exertional heatstroke. Nat. Rev. Dis. Prim. 8 (1), 8. 10.1038/s41572-021-00334-6 - DOI - PubMed
    1. Bouchama A., Knochel J. P. (2002). Heat stroke. N. Engl. J. Med. 346, 1978–1988. 10.1056/NEJMra011089 - DOI - PubMed
    1. Capozzi A., Riitano G., Recalchi S., Manganelli V., Costi R., Saccoliti F., et al. (2021). Effect of heparanase inhibitor on tissue factor overexpression in platelets and endothelial cells induced by anti-β2-GPI antibodies. J. Thromb. Haemost. 19 (9), 2302–2313. 10.1111/jth.15417 - DOI - PMC - PubMed
    1. Caputa M., Dokladny K., Kurowicka B. (2000). Endotoxaemia does not limit heat tolerance in rats: the role of plasma lipoproteins. Eur. J. Appl. Physiol. 82 (1-2), 142–150. 10.1007/s004210050664 - DOI - PubMed

LinkOut - more resources