. 2025 Jun 23:12:1562509.
doi: 10.3389/fnut.2025.1562509. eCollection 2025.

High intake of n-6 polyunsaturated fatty acid exacerbates non-alcoholic steatohepatitis by the involvement of multiple metabolic pathways

Affiliations

High intake of n-6 polyunsaturated fatty acid exacerbates non-alcoholic steatohepatitis by the involvement of multiple metabolic pathways

Jian-Tong et al. Front Nutr. .

Abstract

Non-alcoholic steatohepatitis (NASH) is characterized by steatosis, inflammation, and hepatocyte damage. A Western-style diet characterized by excessive n-6 polyunsaturated fatty acid (n-6 PUFA) intake, which is metabolized to pro-inflammatory arachidonic acids (AAs), might contribute to the exacerbation of NASH. Investigating the interactive effects of choline deficiency and n-6 PUFA supplementation on NASH progression, we aimed to elucidate how AA metabolites, such as leukotrienes, prostaglandins, and the CYP2J3/epoxyeicosatrienoic acids (EET) pathway influence disease pathogenesis. Rats were fed one of four diets: choline-sufficient with low n-6 PUFA and high saturated fatty acid (SFA) (C1), choline-sufficient with high n-6 PUFA (C2), choline-deficient with high n-6 PUFA (D1), or choline-deficient with low n-6 PUFA and high SFA (D2). Liver damage, inflammation, and oxidative stress in D1 were more than compared to C2 and D2 groups. Aggravation of NASH in D1 was accompanied by reduced levels of 15-deoxy-Δ12,14-prostaglandin J2 and PPAR-γ, weakening anti-inflammatory effects and lipid metabolism. Decreased CYP2J3 expression along with reduced PPAR-α levels, likely contributed to reduced anti-inflammatory EET levels, while elevated soluble epoxide hydrolase increased pro-inflammatory dihydroxyeicosatrienoic acids. Additionally, higher leukotriene C4 and 15-hydroxyeicosatetraenoic acid levels via the lipoxygenase pathway exacerbated inflammation. The combined pathway alterations in the D1 group increased inflammation, leading to elevated NF-κB expression, Kupffer cell polarization to M1, and lipid peroxidation, with n-6 PUFA interacting with choline deficiency to exacerbate these effects. Correlational analysis revealed significant associations between these pathways and inflammatory/oxidative markers. Our findings suggest that high intake of n-6 PUFA could aggravate NASH.

Keywords: arachidonic acid; choline deficiency; leukotrienes; lipoxygenase pathway; n-6 polyunsaturated fatty acids; non-alcoholic steatohepatitis.


Conflict of interest statement

The authors declare that the research was conducted in the absence of any commercial or financial relationships that could be construed as a potential conflict of interest.

Figures

Figure 1
Figure 1
A schematic diagram representing study design. Diet compositions are detailed in Supplementary Table S1. The study was approved by the Ethics Committee of Yanbian University (Approval number: YD20231027006). Further details can be found in the Materials and Methods section, under Animal Treatments.
Figure 2
Figure 2
Effects of n-6 PUFA on liver index, wet weight, and biochemical markers in rats with NASH induced by a choline-deficient diet. (A) Body mass, (B) liver wet weight, (C) liver index, (D) serum AST, and (E) ALT levels. Data are expressed as mean ±SEM (n = 6/group).
Figure 3
Figure 3
The effects of n-6 PUFA on liver histopathology in rats with NASH induced by a choline-deficient diet and. (A) Representative photomicrographs of liver sections stained with H&E (Scale bar – 50 μM). Refer to Supplementary Figure S1 for full-size images. (B) Steatosis, (C) Ballooning, (D) Inflammation and necrosis, (E) Grade of activity, and (F) SAF score. Data are expressed as mean ±SEM; n = 6/group.
Figure 4
Figure 4
Effects of n-6 PUFA on liver lipid peroxidation and the inflammatory marker NF-κB in rats with NASH induced by a choline-deficient diet. (A) Liver MDA levels, (B) PPAR-α mRNA expression in the liver. Data are expressed as mean ±SEM; n = 6/group. (C) NF-κB protein expression (~65 kDa) in the liver as analyzed by Western blotting, normalized to GAPDH, with a representative blot (left) and quantification (right). Protein molecular weight standards (kDa) are labeled on the left of each blot. Data are expressed as mean ± SEM; n = 6/group.
Figure 5
Figure 5
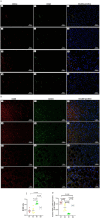
Effects of n-6 PUFA on liver macrophage phenotype in rats with NASH induced by a choline-deficient diet. (A) M1-type Kupffer cells (KCs) identified by double staining: red arrows show CD11c-positive cells, green arrows show CD68-positive cells, and yellow arrows highlight CD11c and CD68 double-positive M1-type KCs (Scale bar – 50 μM). (B) M2-type KCs identified similarly, with red arrows indicating CD163-positive cells, green arrows showing CD68-positive cells, and yellow arrows marking CD163 and CD68 double-positive M2-type KCs (Scale bar – 50 μM). For (A,B) (see Supplementary Figure S2) for full-size photomicrographs. (C) M1/M2 phenotype ratio (unitless), calculated as the proportion of CD68 + CD11c + to CD68 + CD163 + cells. (D) Relative PPAR-γ2 mRNA expression (fold change normalized to GAPDH) in the liver, which is linked to macrophage polarization and inflammation. Data are expressed as mean ±SEM; n = 6/group.
Figure 6
Figure 6
Effects of n-6 PUFA on liver cytokine levels in rats with NASH induced by a choline-deficient diet. (A) TNF-α and (B) IL-1β as pro-inflammatory cytokines; (C) IL-4 and (D) IL-10 as anti-inflammatory cytokines. Data are expressed as mean ±SEM; n = 6/group.
Figure 7
Figure 7
Effects of n-6 PUFA on the liver CYP450 pathway in rats with NASH induced by a choline-deficient diet. (A) mRNA expression of CYP450 enzyme Cyp2j3. (B) Heat map showing concentrations of CYP450 metabolites, with warm colors (red) indicating higher levels and cool colors (blue) indicating lower levels. (C,D) Levels of CYP450 metabolites 5,6-EET and DHETs, (E) sEH enzyme activity. Data are expressed as mean ±SEM; n = 6/group.
Figure 8
Figure 8
Effects of n-6 PUFA on the liver LO pathway in rats with NASH induced by a choline-deficient diet. (A) LTC4 and (B) LTC4S enzyme, and (C) 15-HETE. Data are expressed as mean ±SEM; n = 6/group.
Figure 9
Figure 9
Effects of n-6 PUFA on the liver COX pathway in rats with NASH induced by a choline-deficient diet. (A) PGE2, (B) PGD2, (C) PGF2α, and (D) 15d-PGJ2. Data are expressed as mean ±SEM; n = 6/group.
Figure 10
Figure 10
Three key pathways exacerbate NASH when n-6 PUFA is combined with a choline-deficient diet. First, the 15d-PGJ2/PPAR-γ pathway: Reduced 15d-PGJ2 decreases PPAR-γ activation, weakening anti-inflammatory effects and lipid metabolism, thereby promoting inflammation. Second, the CYP2J3/EETs pathway: Lower CYP2J3 expression decreases anti-inflammatory EETs, while increased sEH converts EETs into pro-inflammatory DHETs, further driving inflammation. Elevated DHETs also stimulate sEH activity in a feedback loop, enhancing the conversion of EETs to DHETs and worsening inflammation. Third, the LO pathway: Increased LTC4 and LTC4S (via the 5-LO pathway) and 15-HETE (via the 15-LO pathway) contribute to inflammation. Together, these pathways amplify NF-κB expression, shift cytokine balance toward a pro-inflammatory state, and promote M1 macrophage polarization over M2, leading to oxidative stress, lipid peroxidation, and hepatocyte damage.

References

    1. Lee GS, Yan JS, Ng RK, Kakar S, Maher JJ. Polyunsaturated fat in the methionine-choline-deficient diet influences hepatic inflammation but not hepatocellular injury. J Lipid Res. (2007) 48:1885–96. doi: 10.1194/jlr.M700181-JLR200, PMID: - DOI - PubMed
    1. Van Herck MA, Vonghia L, Francque SM. Animal models of nonalcoholic fatty liver disease-a starter's guide. Nutrients. (2017) 9:1072. doi: 10.3390/nu9101072, PMID: - DOI - PMC - PubMed
    1. Liu M, Song XZ, Yang L, Fang YH, Lan L, Cui JS, et al. 1,25-Dihydroxyvitamin D3 improves non-alcoholic Steatohepatitis phenotype in a diet-induced rat model. Front Endocrinol. (2025) 16:1528768. doi: 10.3389/fendo.2025.1528768, PMID: - DOI - PMC - PubMed
    1. Warner JB, Zirnheld KH, Hu H, Floyd A, Kong M, McClain CJ, et al. Analysis of alcohol use, consumption of micronutrient and macronutrients, and liver health in the 2017-2018 National Health and nutrition examination survey. Alcohol Clin Exp Res. (2022) 46:2025–40. doi: 10.1111/acer.14944, PMID: - DOI - PMC - PubMed
    1. Miura K, Yang L, van Rooijen N, Brenner DA, Ohnishi H, Seki E. Toll-like receptor 2 and palmitic acid cooperatively contribute to the development of nonalcoholic Steatohepatitis through Inflammasome activation in mice. Hepatology. (2013) 57:577–89. doi: 10.1002/hep.26081, PMID: - DOI - PMC - PubMed

LinkOut - more resources